Fig. 2.
Download original image
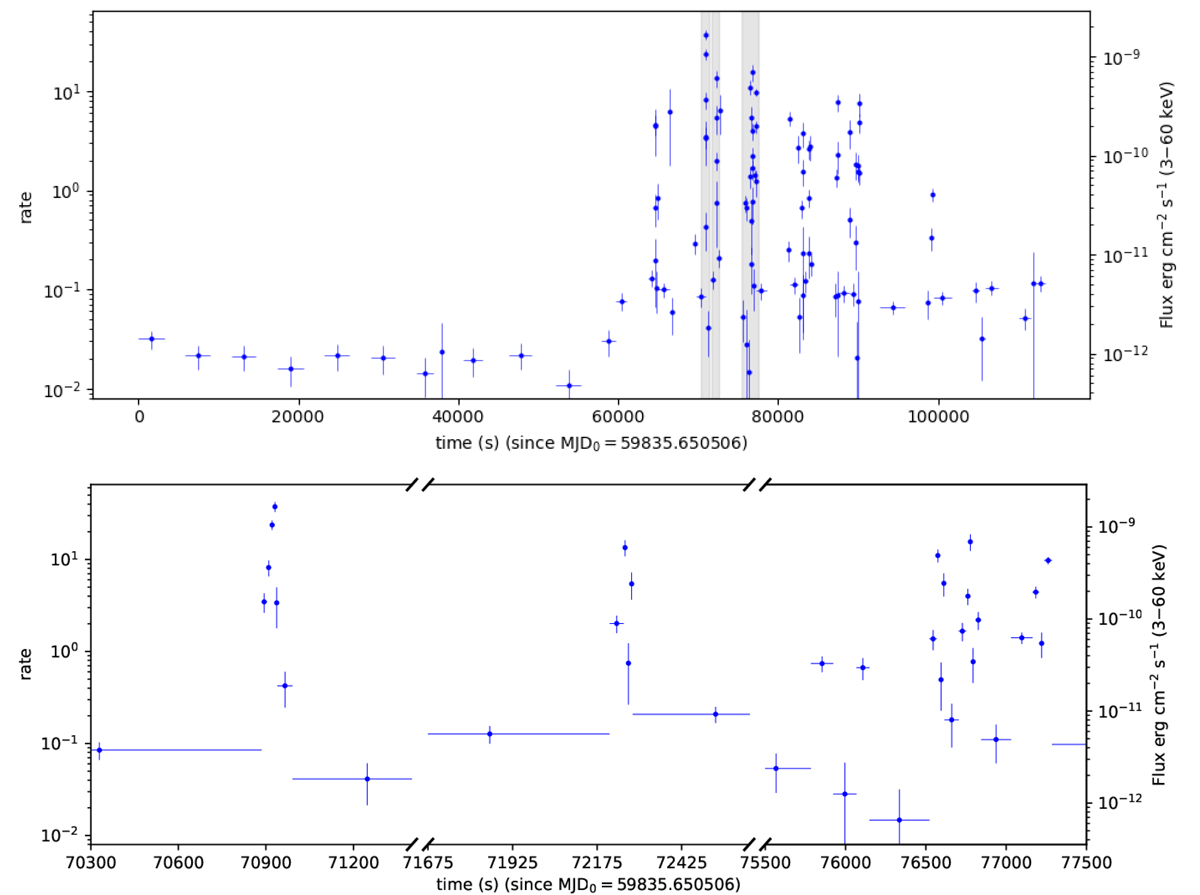
NuSTAR light curve in the energy range 3−60 keV obtained through the Bayesian block segmentation method. Top panel: light curve over the entire observation period. Bottom panels: three zoomed-in sections of the light curve (corresponding to the three grey-shaded areas in the top panel) to better show the typical time duration and structures of the flares. The ‘holes’ among bins, especially noticeable in the low-luminosity state of the top panel, arise from the passage of NuSTAR through the South Atlantic Anomaly regions.
Current usage metrics show cumulative count of Article Views (full-text article views including HTML views, PDF and ePub downloads, according to the available data) and Abstracts Views on Vision4Press platform.
Data correspond to usage on the plateform after 2015. The current usage metrics is available 48-96 hours after online publication and is updated daily on week days.
Initial download of the metrics may take a while.