Fig. 6
Download original image
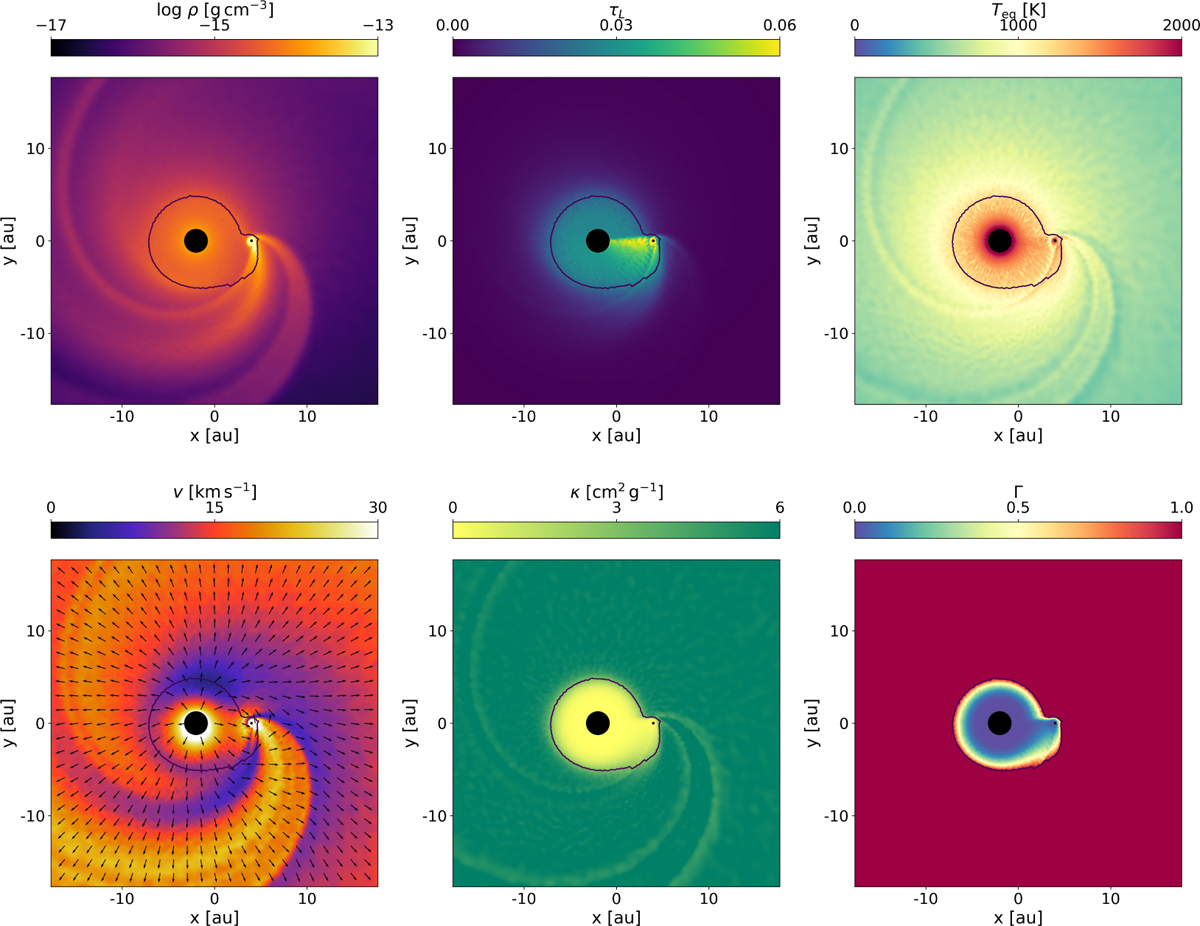
Relevant properties of the high mass-loss rate binary simulation using the Lucy approximation. The density is plotted in the upper left panel, the Lucy optical depth in the upper middle panel, the dust temperature in the top right panel, the velocity in the lower left panel, the opacity in the lower middle panel, and the Eddington factor in the lower right panel. The thin solid black contour indicates the location of the dust condensation surface.
Current usage metrics show cumulative count of Article Views (full-text article views including HTML views, PDF and ePub downloads, according to the available data) and Abstracts Views on Vision4Press platform.
Data correspond to usage on the plateform after 2015. The current usage metrics is available 48-96 hours after online publication and is updated daily on week days.
Initial download of the metrics may take a while.