Fig. 2
Download original image
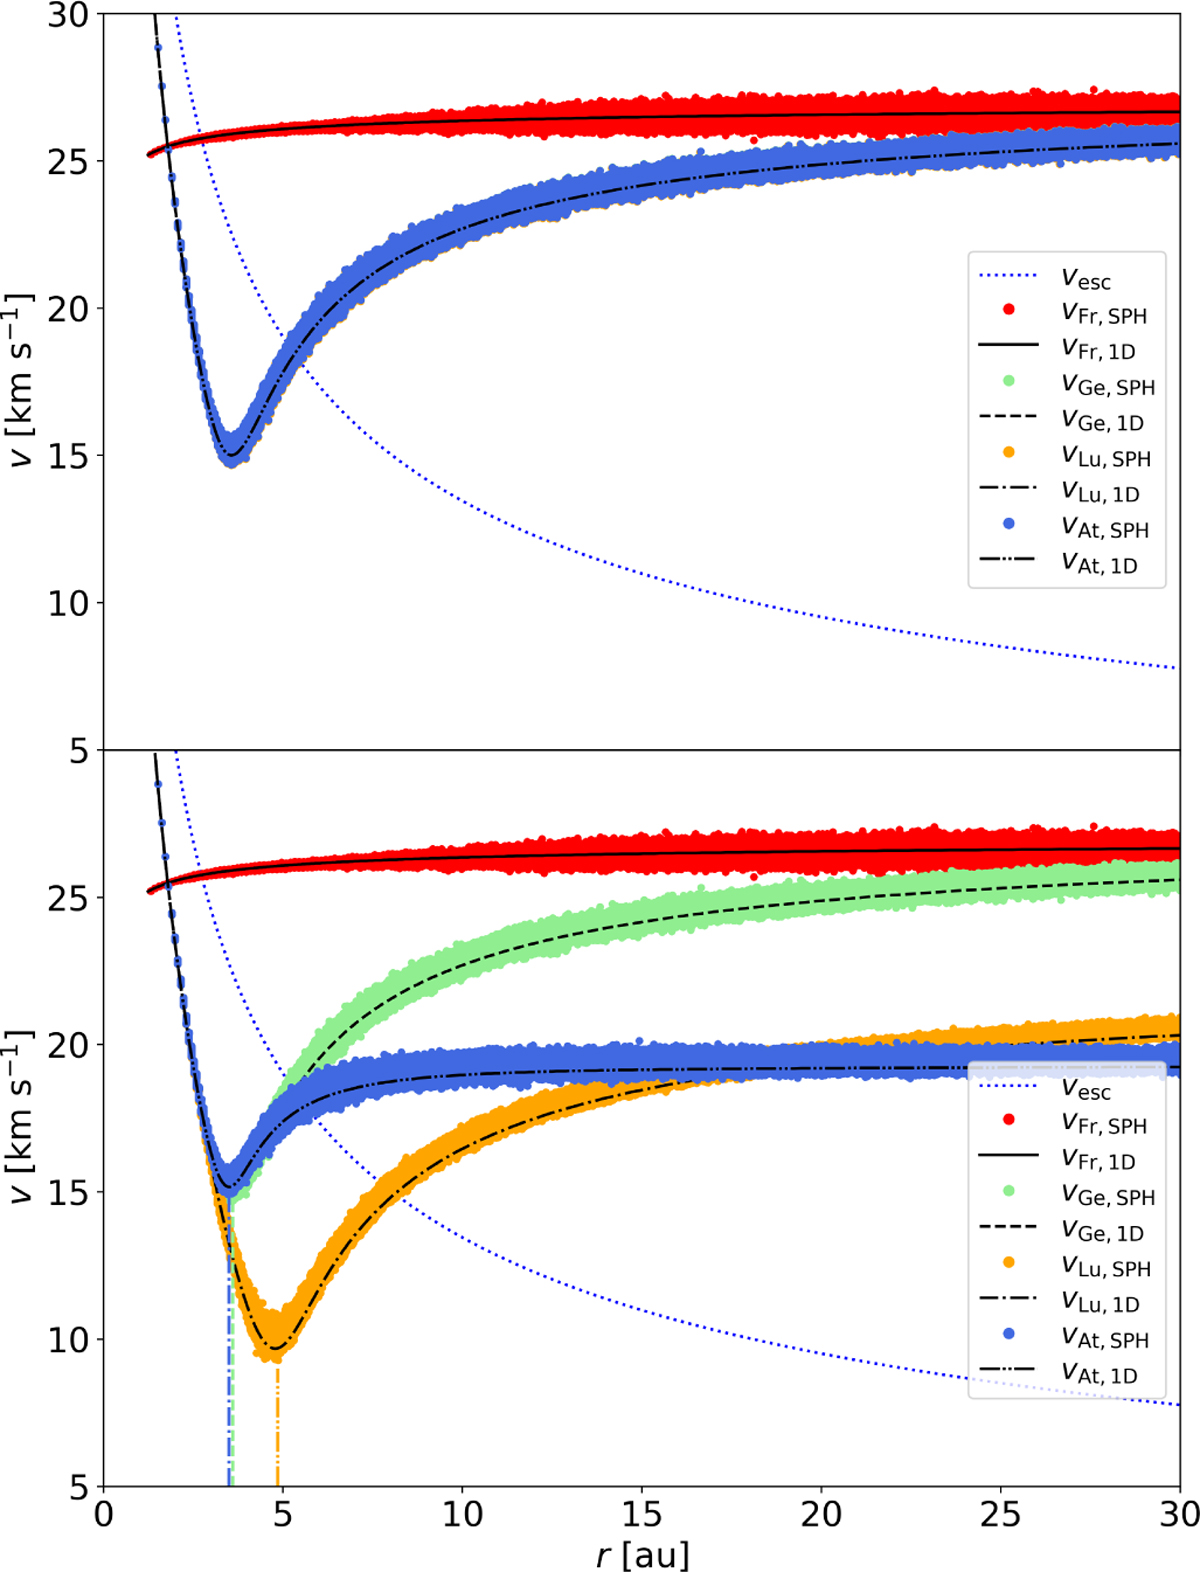
Velocity profiles from the SPH simulation (points) and 1D semi-analytical wind solution (lines) in a single-star configuration for the low (ṀAGB = 10−8 M⊙ yr−1, upper panel) and the high (ṀAGB = 3 × 10⁻⁶ M⊙ yr−1, bottom panel) mass-loss rate models. The free-wind approximation (red SPH points and 1D solid line profile), the geometrical approximation (light-green and dashed line), the Lucy approximation (orange and dash-dotted line), and the attenuation approximation (blue and dashed-double dotted line) are shown. The geometrical, Lucy, and attenuation approximation overlap in the upper panel. The vertical lines in the lower panel indicate the corresponding dust condensation radius for the geometrical, Lucy, and attenuation approximation. The dotted line shows the escape velocity.
Current usage metrics show cumulative count of Article Views (full-text article views including HTML views, PDF and ePub downloads, according to the available data) and Abstracts Views on Vision4Press platform.
Data correspond to usage on the plateform after 2015. The current usage metrics is available 48-96 hours after online publication and is updated daily on week days.
Initial download of the metrics may take a while.