Fig. 1
Download original image
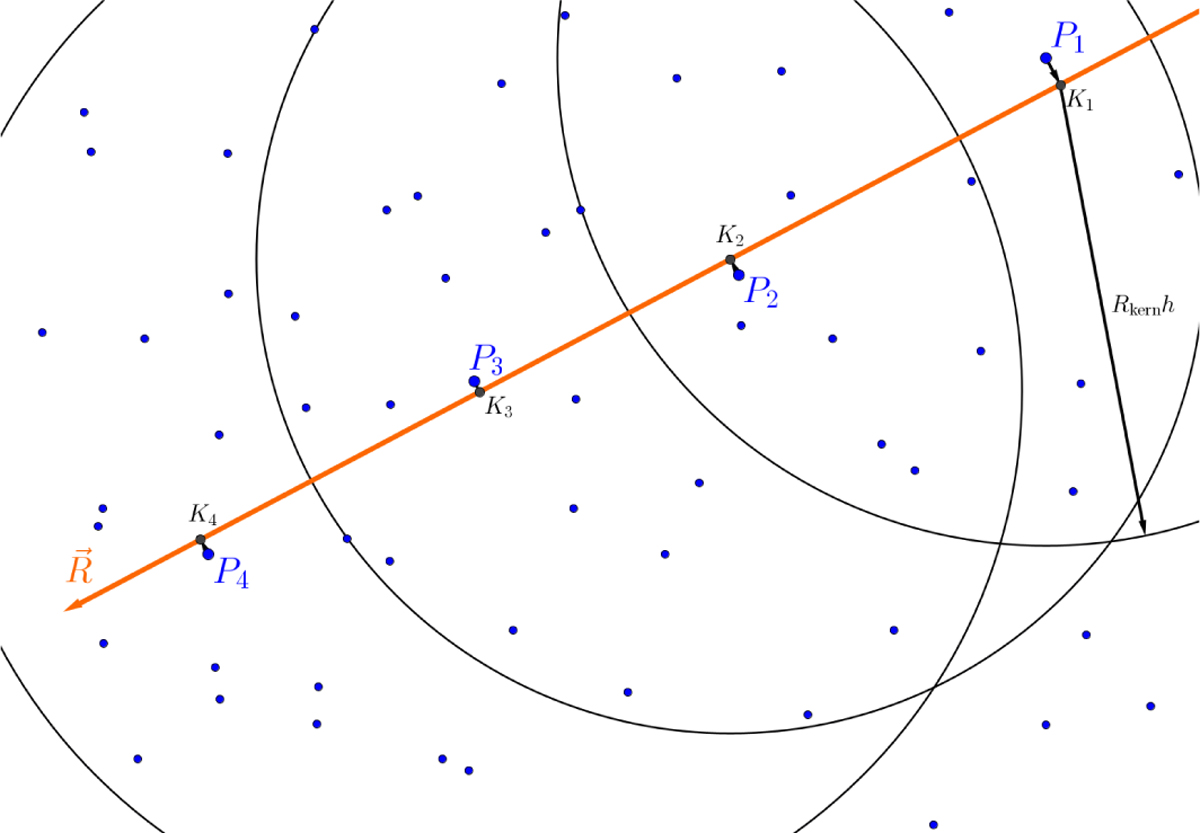
Visual representation of the ray-tracing algorithm. Starting from the upper right corner at point P1 and following the direction of the ray, the subsequent point P2 is determined within the sphere of influence of radius Rkernh. The procedure is then repeated until the boundary of the domain is reached (see text for explanations).
Current usage metrics show cumulative count of Article Views (full-text article views including HTML views, PDF and ePub downloads, according to the available data) and Abstracts Views on Vision4Press platform.
Data correspond to usage on the plateform after 2015. The current usage metrics is available 48-96 hours after online publication and is updated daily on week days.
Initial download of the metrics may take a while.