Fig. A.3
Download original image
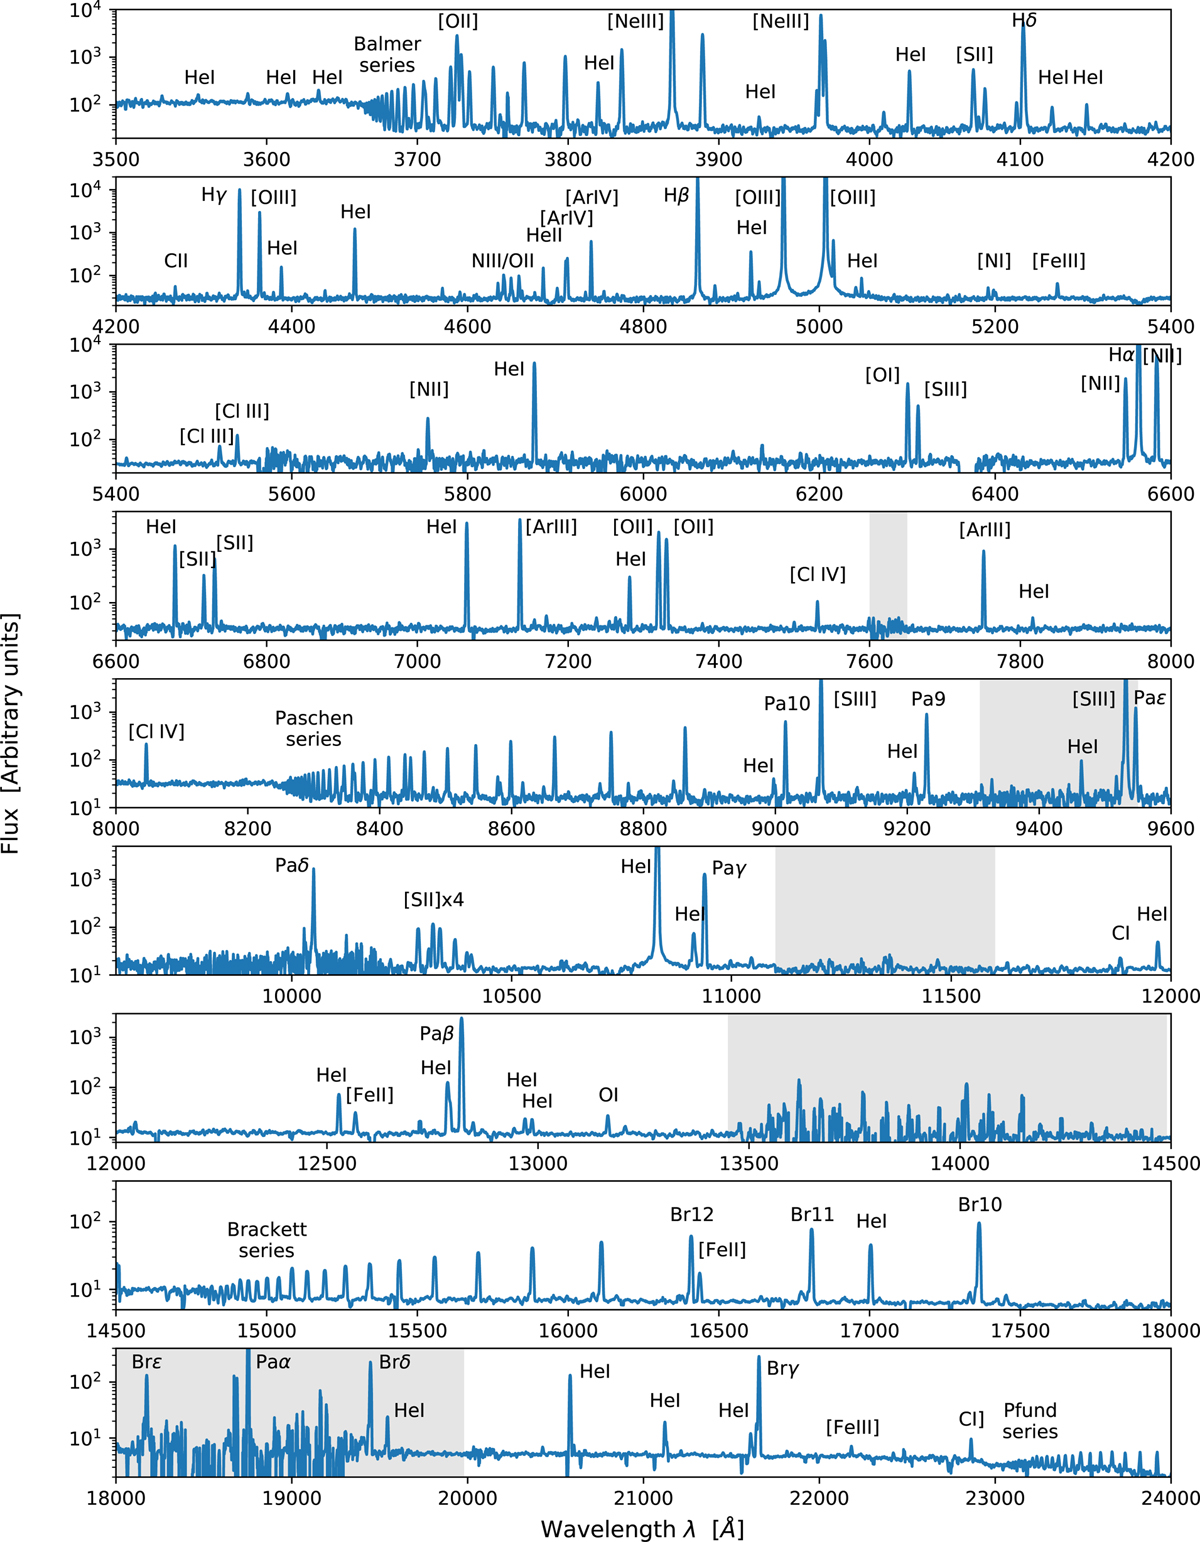
X-shooter spectrum of PN G042.9-06.9, rebinned by factors 5–20 for illustrative purposes. The UVB range between 3000–3500 Å is not shown, as the only brighter line is He λ3189. We labelled the brightest and some of the weaker lines in the rest of the spectrum; no attempt was made to accurately label line blends. In total, we report 253 lines with measured fluxes in this spectrum (Table A.1), one of the richest in our sample. We note that the panels’ y-axis ranges are different, and that the log-scale exaggerates the width of the brightest lines such as [O III]λ5008 or He I λ10830. The grey areas indicate the atmospheric A-band at 7600 Å, and other absorption bands where atmospheric transmission is reduced by at least 10% at zenith for a precipitable water vapour of 1 mm, as reported in the ESO VISTA (Sutherland et al. 2015) instrument description.
Current usage metrics show cumulative count of Article Views (full-text article views including HTML views, PDF and ePub downloads, according to the available data) and Abstracts Views on Vision4Press platform.
Data correspond to usage on the plateform after 2015. The current usage metrics is available 48-96 hours after online publication and is updated daily on week days.
Initial download of the metrics may take a while.