Fig. 6
Download original image
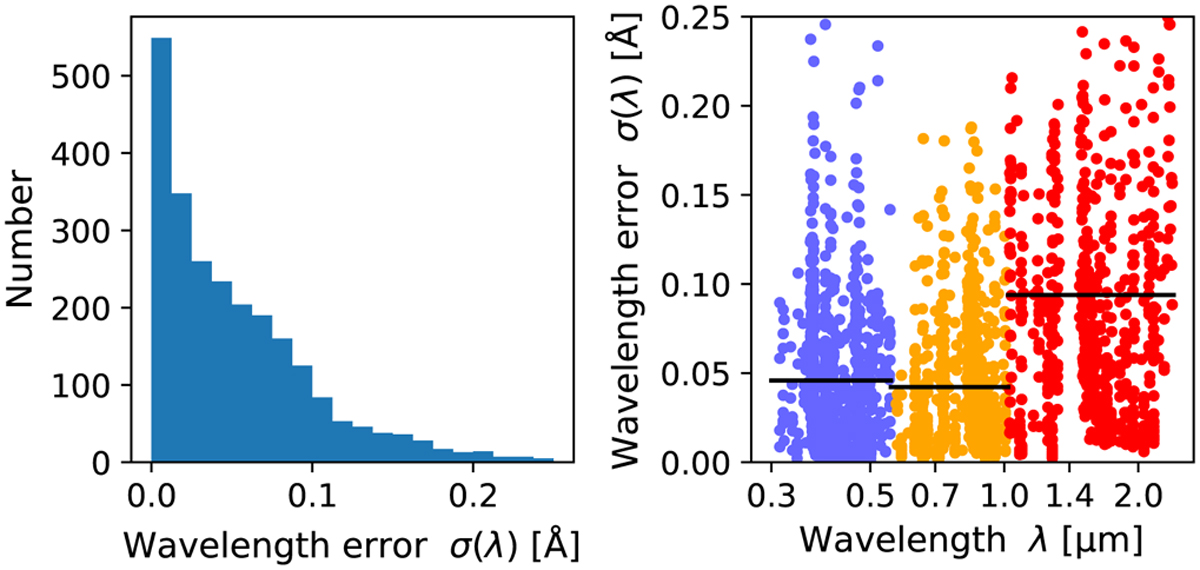
Statistical line centroid errors for all PNe in our sample. Left panel: distribution of the statistical line centroid errors. Right panel: line centroid error as a function of wavelength. The UVB, VIS and NIR ranges are colour coded; the black horizontal lines show the mean statistical error of 0.046, 0.042, and 0.094 Å, respectively. The GMOS/GNIRS data for DdDm-1 follow the same colour-coding and are not distinguished in this plot.
Current usage metrics show cumulative count of Article Views (full-text article views including HTML views, PDF and ePub downloads, according to the available data) and Abstracts Views on Vision4Press platform.
Data correspond to usage on the plateform after 2015. The current usage metrics is available 48-96 hours after online publication and is updated daily on week days.
Initial download of the metrics may take a while.