Fig. 5
Download original image
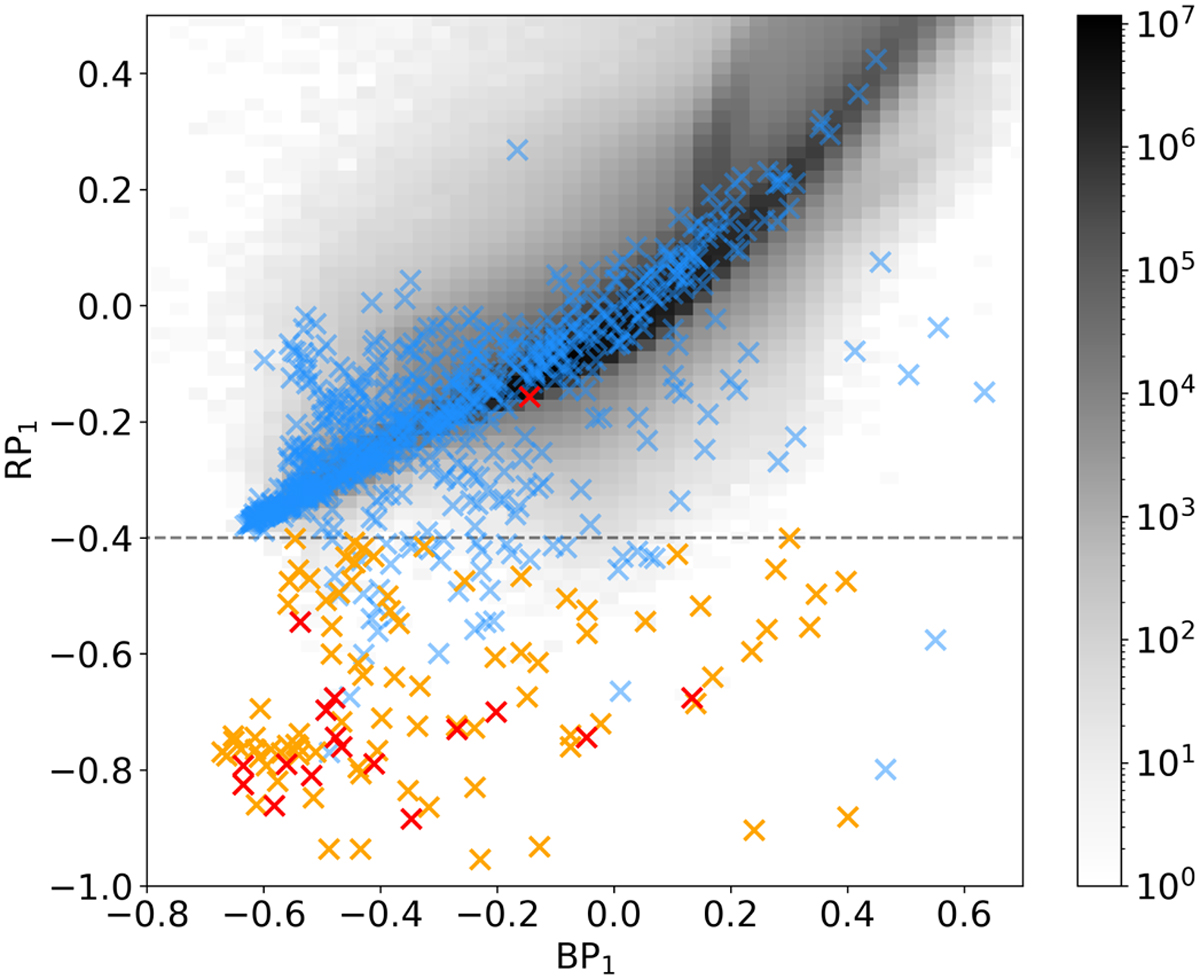
Normalised 1st-order shape coefficients (assuming 0 indexing) of the BP and RP Gaia spectra. The logarithmic density of all 200 million Gaia sources in this space is indicated by the grey cells. Our sample of compact PNe (Table 1) is shown by the red crosses if they had Gaia DR3 BP/RP spectra, and known or candidate PNe from Chornay & Walton (2021) by light blue crosses. The latter follow the bulk of the Gaia sources, suggesting that their SEDs are continuum-dominated; a small subset shows low RP1 values and approach our sample of compact PNe. Compact PNe candidates with RP1 < −0.4 are shown in orange, but were rejected/disqualified upon further inspection (Sect. 4.3).
Current usage metrics show cumulative count of Article Views (full-text article views including HTML views, PDF and ePub downloads, according to the available data) and Abstracts Views on Vision4Press platform.
Data correspond to usage on the plateform after 2015. The current usage metrics is available 48-96 hours after online publication and is updated daily on week days.
Initial download of the metrics may take a while.