Fig. 1
Download original image
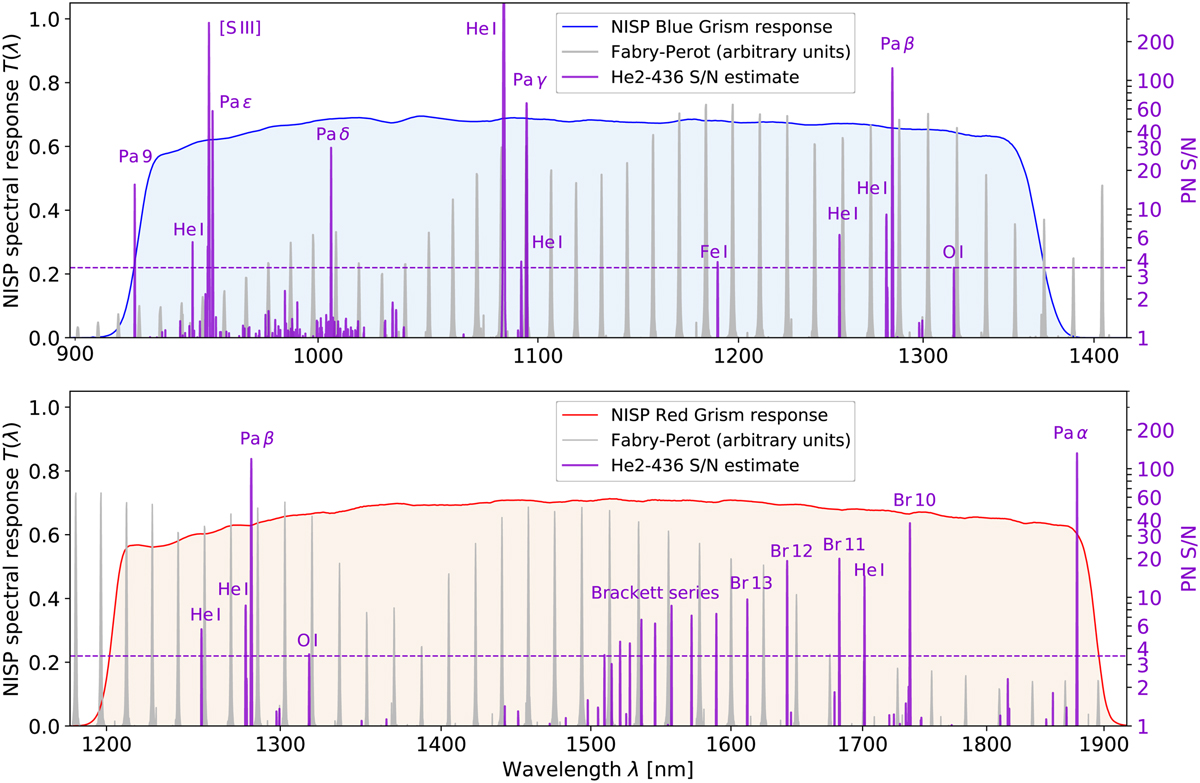
Total system response for the NISP grisms and emission line signal-to-noise ratios (S/N). Top panel: total system response for the NISP blue grism (shaded area, exceeding 50% of its peak transmission between 0.93–1.37 µm; these data are updated with respect to those presented in ESc22). The regularly spaced, grey spectrum shows the arbitrarily scaled Fabry-Perot emission lines used for the pre-flight calibration of the dispersion law. As an example for the in-flight calibration, the purple spectrum shows the estimated NISP S/N of He2-436, extrapolated from our X-shooter observations. The horizontal dashed line displays a 3.5σ threshold to identify usable PN lines. Bottom panel: same as for the other panel, but for the NISP red grism (1.21–1.89 µm).
Current usage metrics show cumulative count of Article Views (full-text article views including HTML views, PDF and ePub downloads, according to the available data) and Abstracts Views on Vision4Press platform.
Data correspond to usage on the plateform after 2015. The current usage metrics is available 48-96 hours after online publication and is updated daily on week days.
Initial download of the metrics may take a while.