Fig. 9.
Download original image
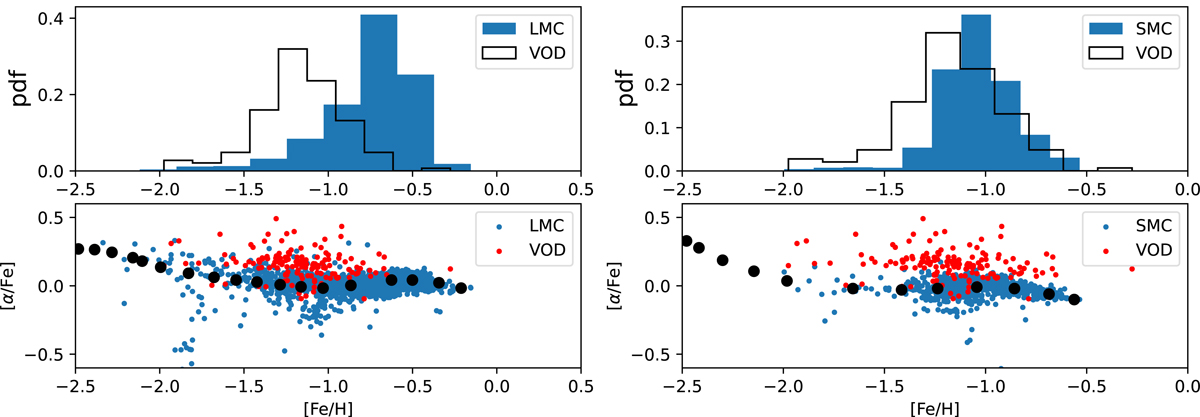
Comparison of elements abundance between VOD and LMC, SMC. Top: histogram distribution of elements abundance in VOD, SMC and LMC regions. The solid black line indicates VOD, the blue indicates SMC and LMC. Bottom: distribution of α elements with [Fe/H]. The red dots indicate VOD members and the blue dots indicate the stars in LMC and SMC regions. The big black dotted line represents the trend line of abundance of LMC and SMC from Nidever et al. (2020).
Current usage metrics show cumulative count of Article Views (full-text article views including HTML views, PDF and ePub downloads, according to the available data) and Abstracts Views on Vision4Press platform.
Data correspond to usage on the plateform after 2015. The current usage metrics is available 48-96 hours after online publication and is updated daily on week days.
Initial download of the metrics may take a while.