Fig. 8.
Download original image
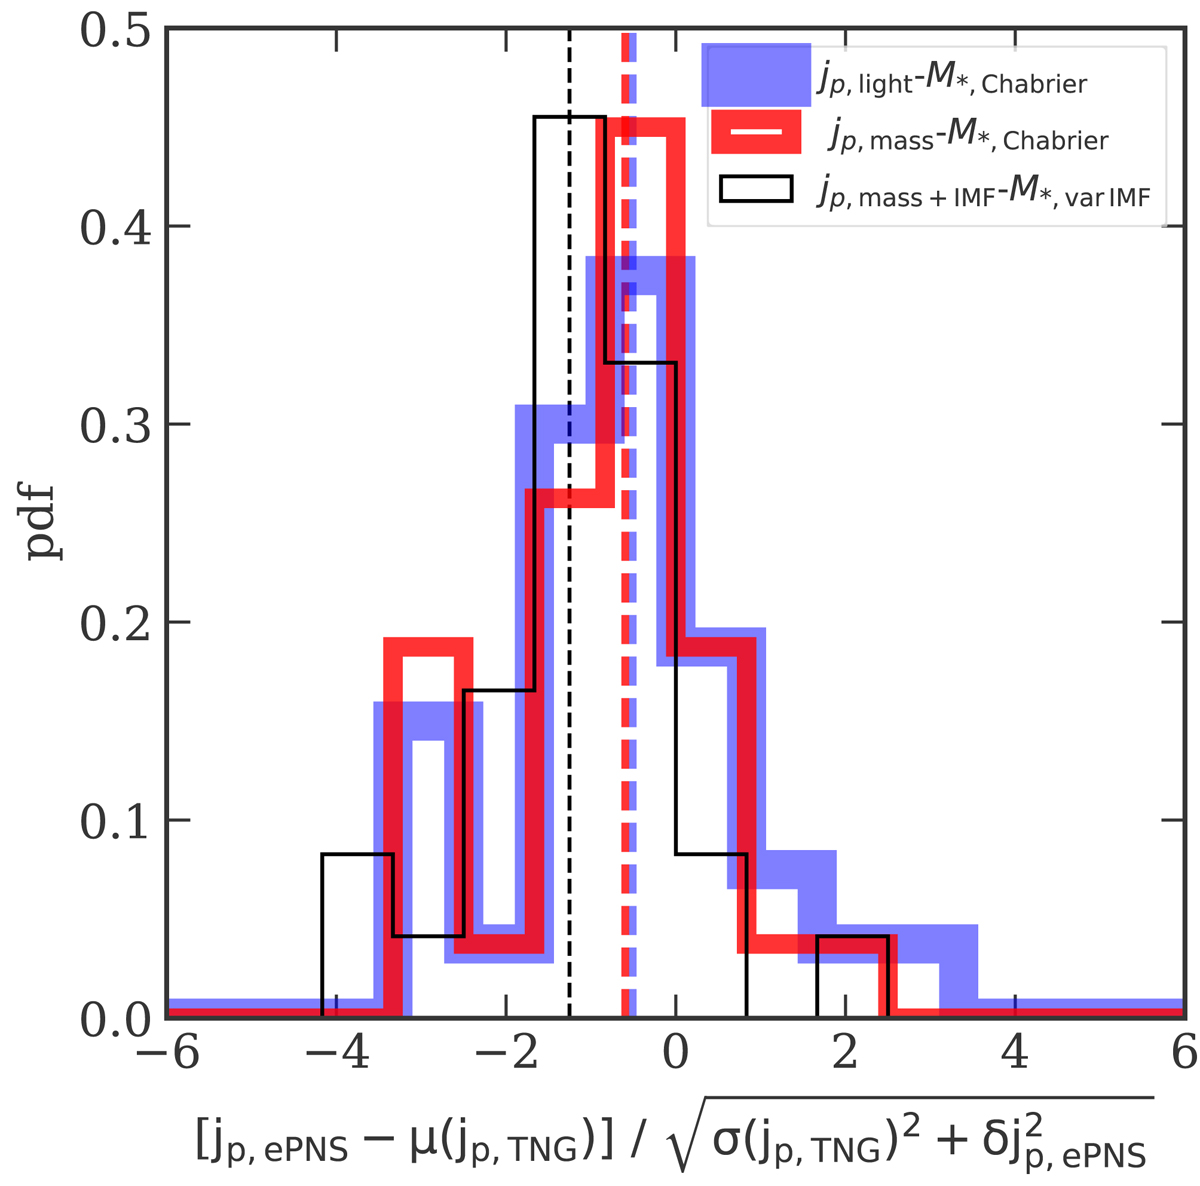
Comparison between the projected sAM of each ePN.S galaxy jp,ePN.S and the median of the distribution of jp(≤6Re) of the ePN.S analogs among the TNG100 ETGs, divided by the sum in quadrature of 1σ-scatter of distribution of the TNG analogs and the error on the ePN.S jp,ePN.S. The three histograms correspond to the three jp determinations for the ePN.S galaxies: the light-weighted jp, light, the mass-weighted jp, mass, and the jp, mass + IMF corrected for IMF gradients. The jp values for the TNG100 galaxies are mass-weighted. Vertical dashed lines show the median of the three distributions.
Current usage metrics show cumulative count of Article Views (full-text article views including HTML views, PDF and ePub downloads, according to the available data) and Abstracts Views on Vision4Press platform.
Data correspond to usage on the plateform after 2015. The current usage metrics is available 48-96 hours after online publication and is updated daily on week days.
Initial download of the metrics may take a while.