Fig. B.1.
Download original image
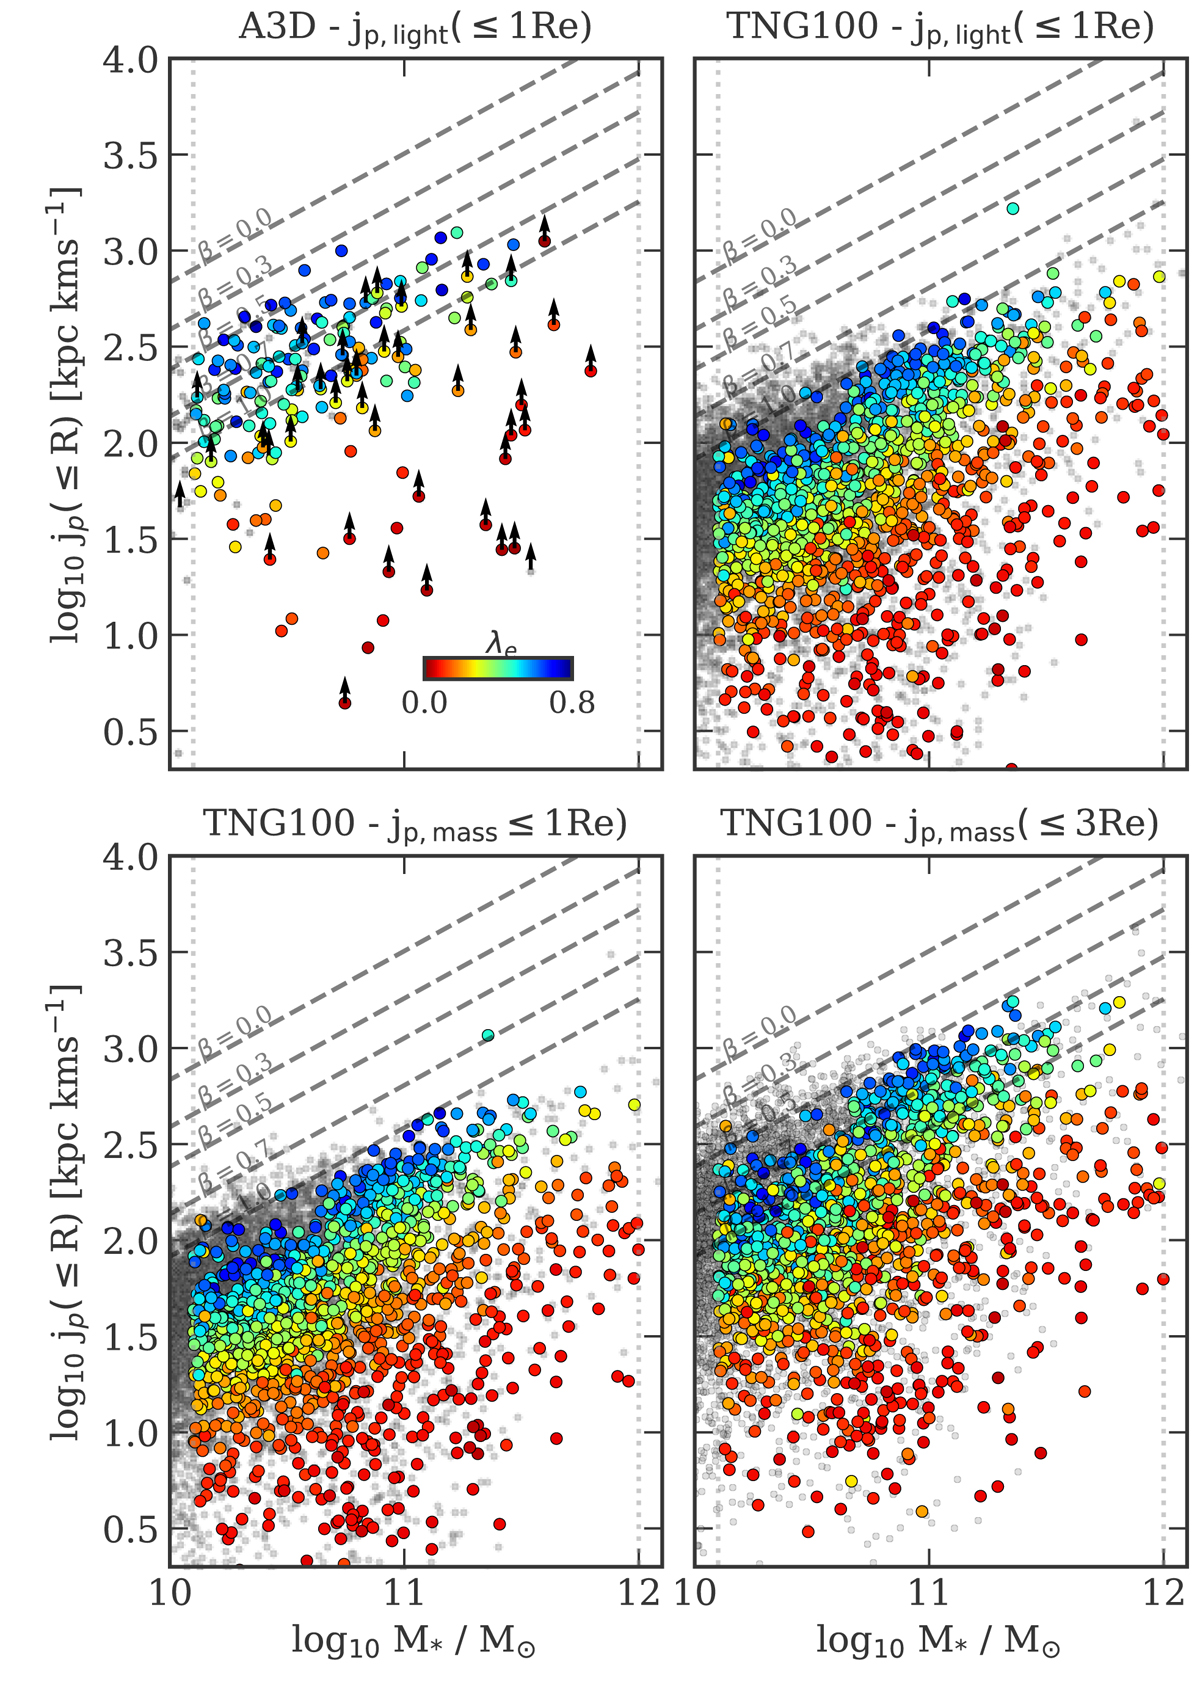
Projected sAM jp(≤ 1Re) in the TNG100 ETGs compared to Atlas3D galaxies. Colored symbols show the sample of ETGs, gray small symbols show all the other galaxies (namely the bluer and lower-mass systems). The ETGs are color-coded according to the angular momentum parameter λe integrated within 1Re. Arrows on the Atlas3D galaxies show values integrated out to a < 1Re, hence the show jp is likely a lower-limit estimate. Dashed black lines show the jt − M* relations for different bulge fractions β as derived by Fall & Romanowsky (2018). The different jp − M* relation between observed and simulated galaxies shows that the TNG100 ETGs have their angular momentum distributed at larger radii.
Current usage metrics show cumulative count of Article Views (full-text article views including HTML views, PDF and ePub downloads, according to the available data) and Abstracts Views on Vision4Press platform.
Data correspond to usage on the plateform after 2015. The current usage metrics is available 48-96 hours after online publication and is updated daily on week days.
Initial download of the metrics may take a while.