Open Access
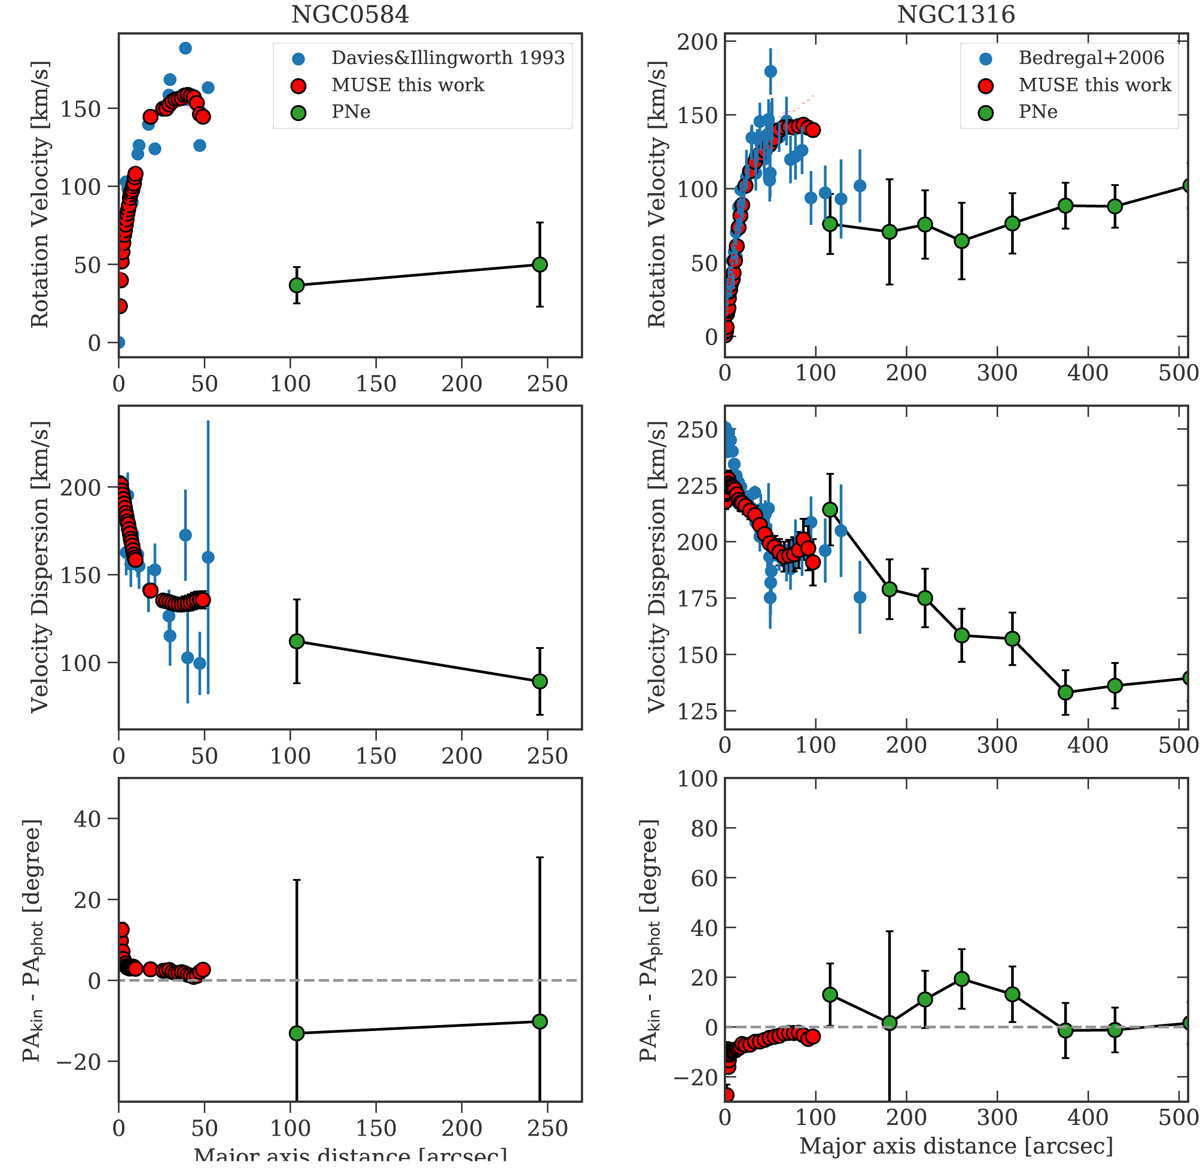
Fig. A.1.
Download original image
Kinematics profiles for the new MUSE velocity fields. The profiles from MUSE are shown with red symbols. Blue symbols show major axis slit data available in the literature (Kormendy & Illingworth 1982; Saglia et al. 2000); green circles show the PN kinematic profiles.
Current usage metrics show cumulative count of Article Views (full-text article views including HTML views, PDF and ePub downloads, according to the available data) and Abstracts Views on Vision4Press platform.
Data correspond to usage on the plateform after 2015. The current usage metrics is available 48-96 hours after online publication and is updated daily on week days.
Initial download of the metrics may take a while.