Fig. 14.
Download original image
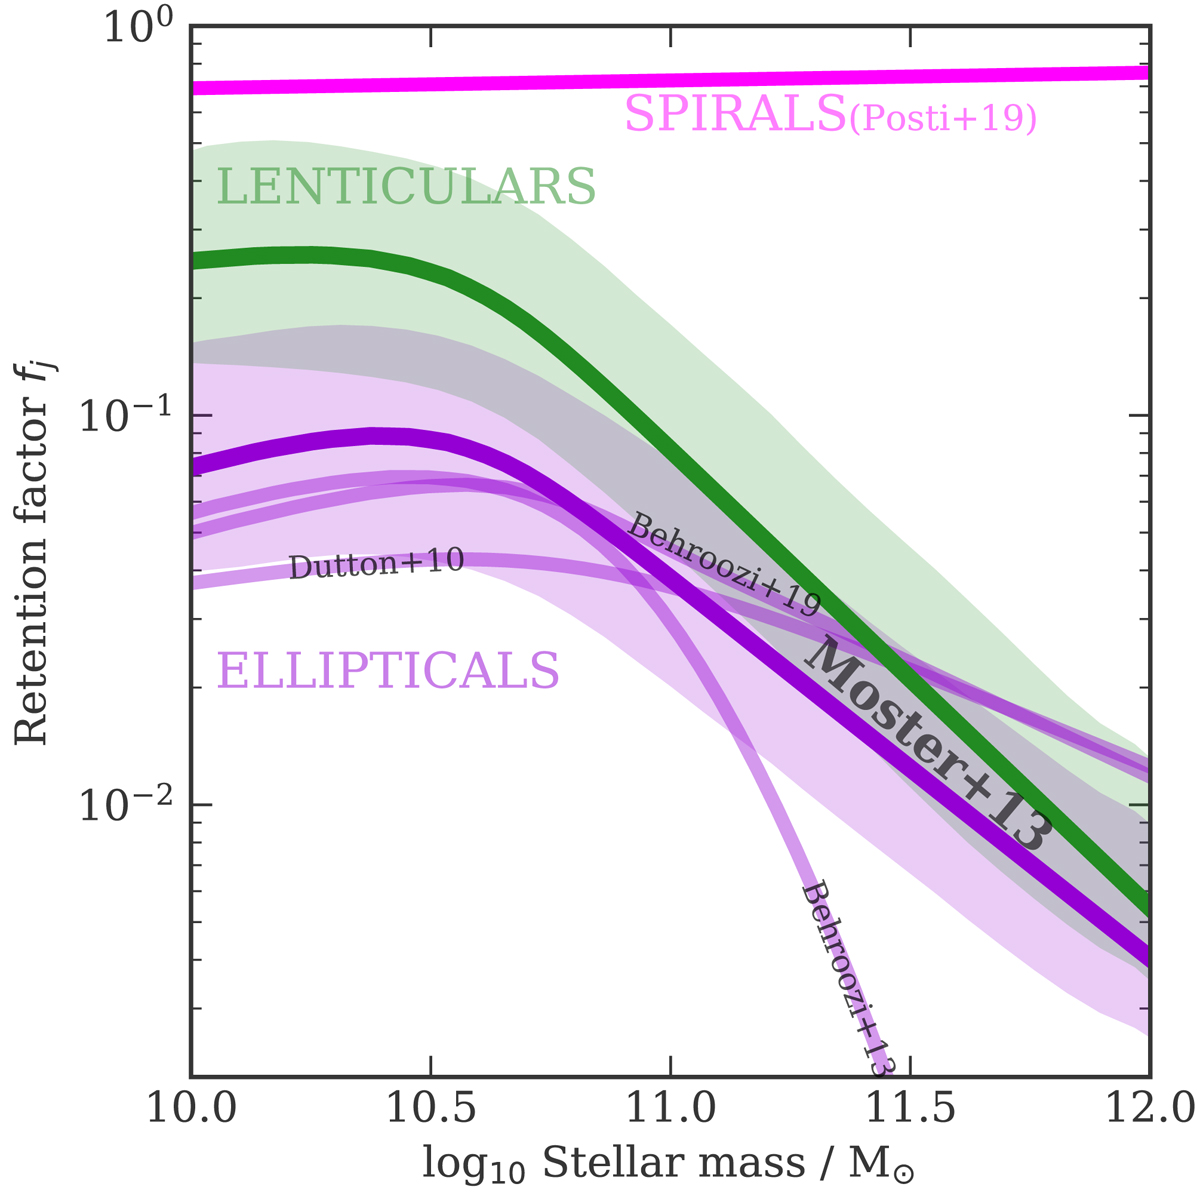
Ratio of the stellar to halo sAM as a function of stellar mass fj(M*) for ETGs assuming the SMHM relation of Moster et al. (2013). Ellipticals and S0s are shown with thick purple and green lines, respectively. Colored bands show the scatter around the median given by the Monte-Carlo simulations described in the text. The thinner purple lines show the median fj(M*) profiles using fM from Dutton et al. (2010) for ETGs, Behroozi et al. (2013, 2019) for quiescent galaxies as labeled. For comparison, we also show the results of Posti et al. (2019) for spiral galaxies with a magenta line.
Current usage metrics show cumulative count of Article Views (full-text article views including HTML views, PDF and ePub downloads, according to the available data) and Abstracts Views on Vision4Press platform.
Data correspond to usage on the plateform after 2015. The current usage metrics is available 48-96 hours after online publication and is updated daily on week days.
Initial download of the metrics may take a while.