Fig. 12.
Download original image
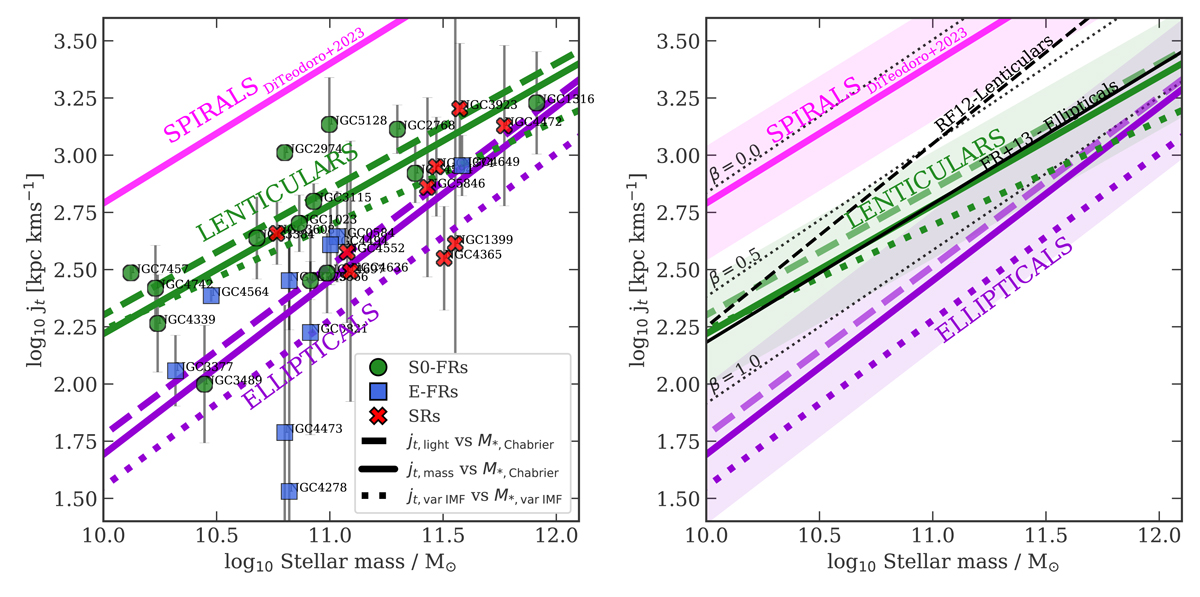
jt − M* plane for the ePN.S galaxies (left) and comparison with previous works (right). Left panel: total sAM of the ePN.S galaxies as a function of their stellar mass. For clarity we only show the mass-weighted jt, mass values data-points. Solid lines show the power-law fit to jt, mass vs. M*; dashed lines show the fit to the mass-weighted jt, light vs. M*; dotted lines show the fit to the values corrected for IMF gradients jt, mass + IMF − M*, var IMF using the mean mass excess profiles from Bernardi et al. (2023) as discussed in Sect. 4.2.2. Green lines refer to S0 galaxies, purple lines refer to the ellipticals. Right panel: dashed green and purple lines show the power-law fits to the ePN.S lenticulars and elliptical galaxies, respectively, as in the left panel. Dotted black lines show the jt − M* relations for different bulge fractions β as derived by Fall & Romanowsky (2018). Dashed and solid black lines show the fits of Romanowsky & Fall (2012) and Fall & Romanowsky (2013) to their sample of S0s and ellipticals. In both panels, the magenta line shows the results of Di Teodoro et al. (2023) on their samples of spiral galaxies.
Current usage metrics show cumulative count of Article Views (full-text article views including HTML views, PDF and ePub downloads, according to the available data) and Abstracts Views on Vision4Press platform.
Data correspond to usage on the plateform after 2015. The current usage metrics is available 48-96 hours after online publication and is updated daily on week days.
Initial download of the metrics may take a while.