Fig. 11.
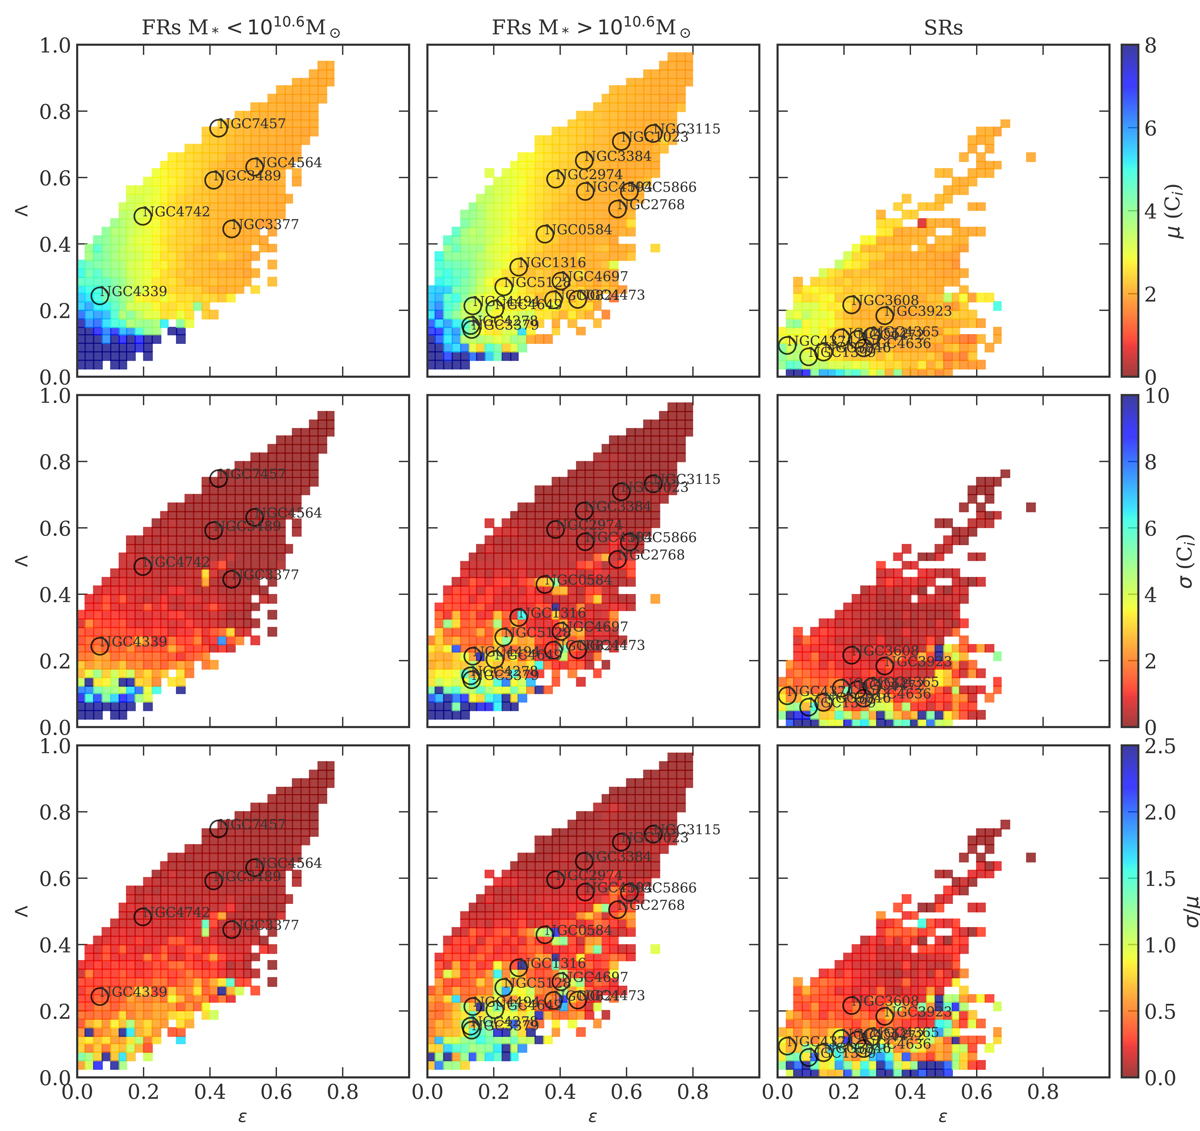
Download original image
Distribution of Ci in the Λ − ε plane, where Λ and ε are measured at the location of maximum rotational support for the entire sample of simulated ETGs. Galaxies are divided in low-mass FRs (left), high-mass FRs (center), and SRs (right). The first row of panels shows the median μ(Ci) in each bin. The second row shows the root-mean-square scatter around the mean, σ(Ci). The third row shows the ratio between scatter and median. The location of the ePN.S galaxies in the Λlight − ε plane is also shown with open circles. For each ePN.S ETG, the median Ci value of its “analogs”, selected to have similar Λ, ε, and M*, is used to “de-project” jp (see Sect. 8).
Current usage metrics show cumulative count of Article Views (full-text article views including HTML views, PDF and ePub downloads, according to the available data) and Abstracts Views on Vision4Press platform.
Data correspond to usage on the plateform after 2015. The current usage metrics is available 48-96 hours after online publication and is updated daily on week days.
Initial download of the metrics may take a while.