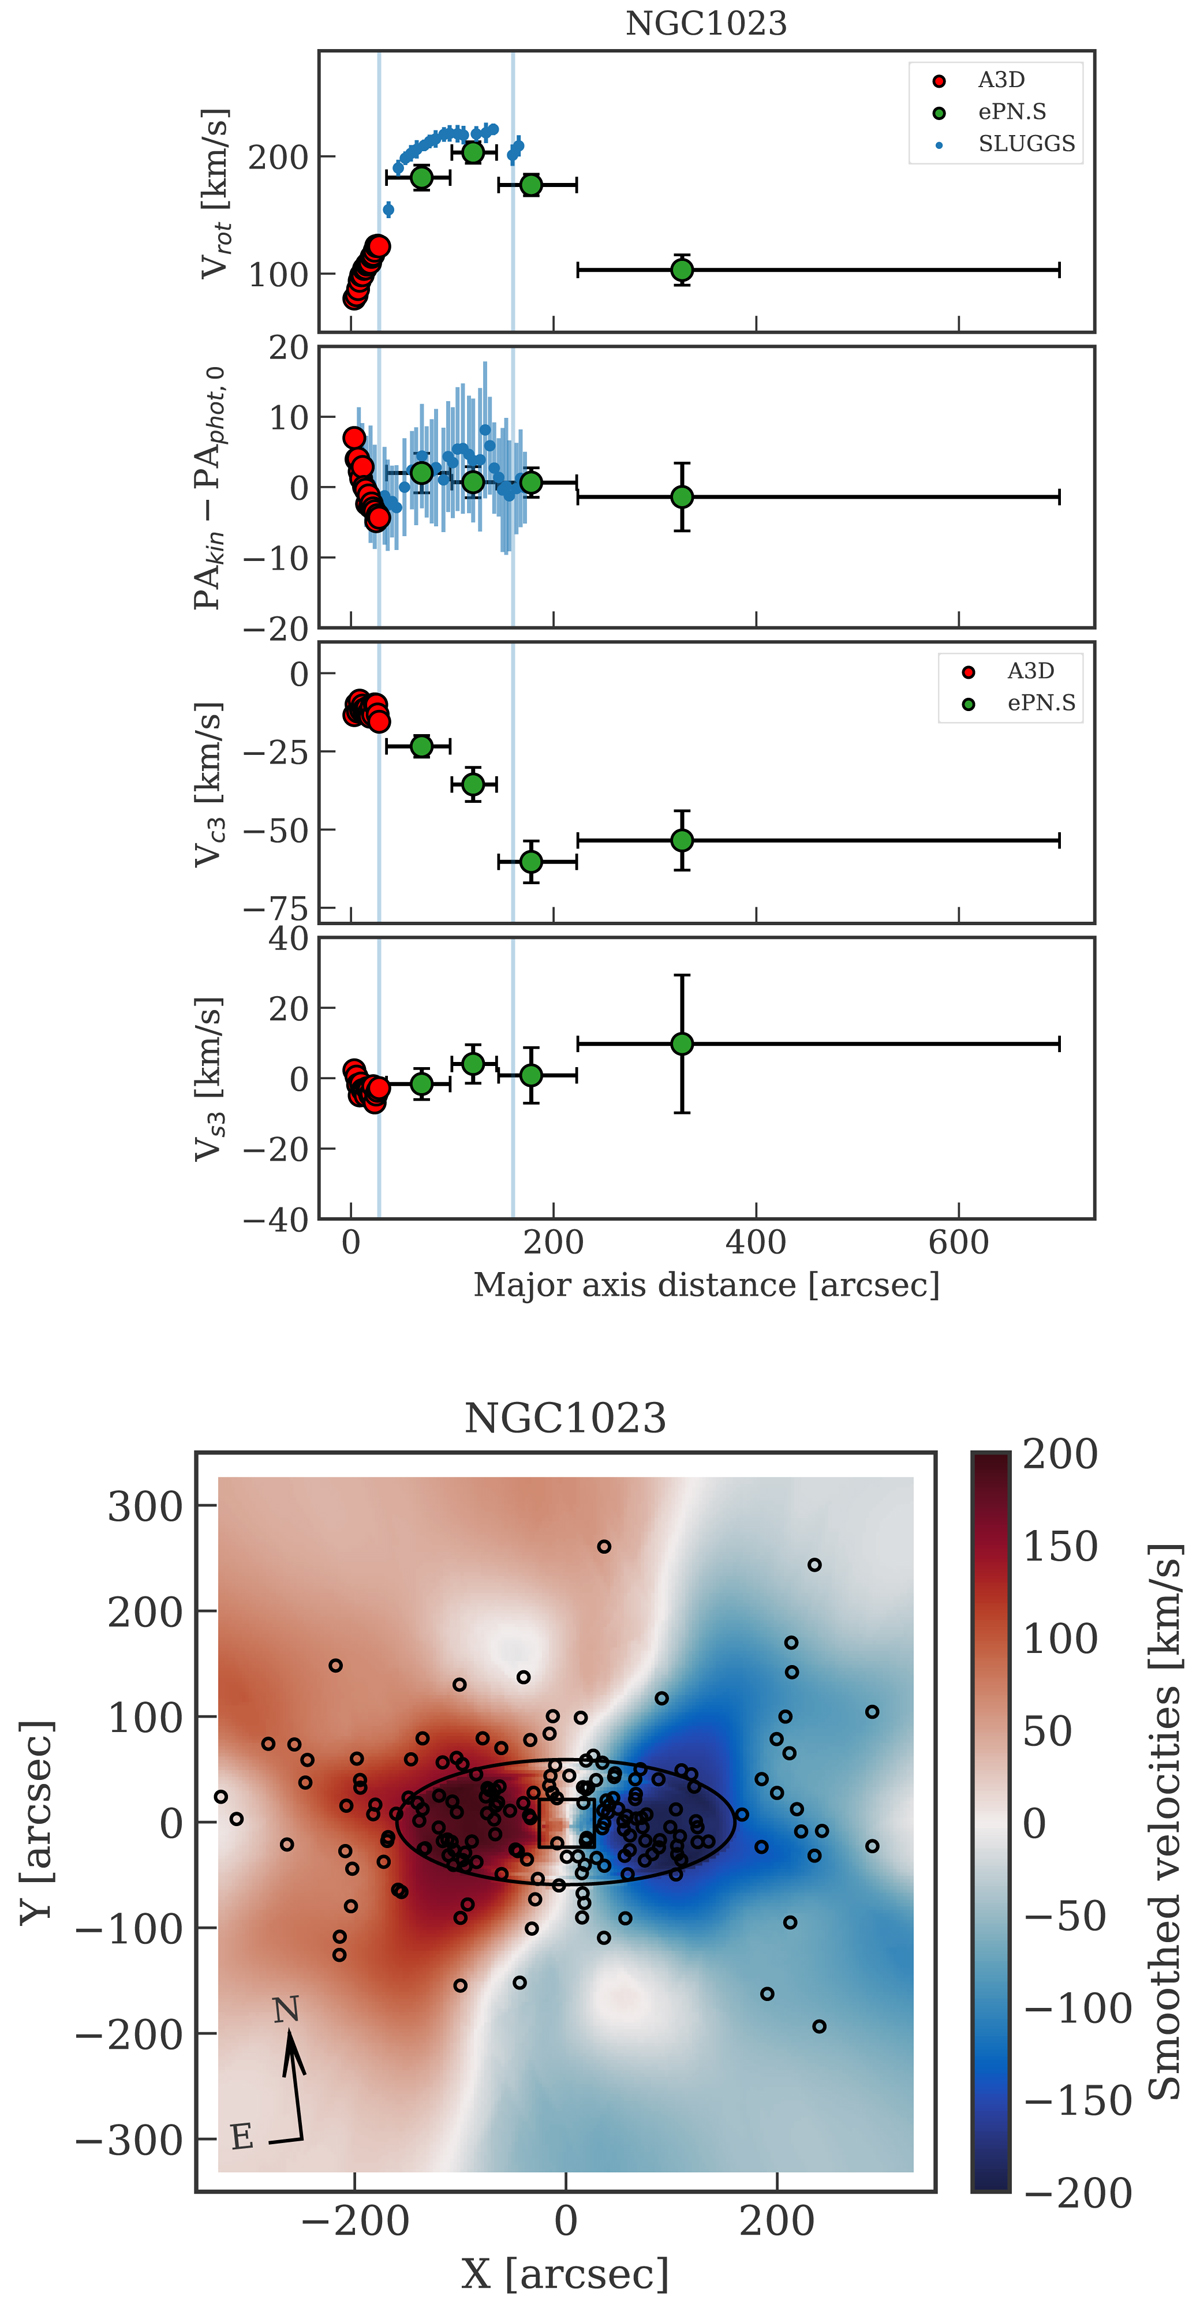
Fig. 1.
Download original image
Kinematic data of NGC1023. Top: fitted kinematic parameters in elliptical bins as a function of major axis distance a for NGC1023 (see Eq. (1)). Results on the Atlas3D velocity field are shown in red, and those on the ePN.S smoothed velocity field are in green. Blue symbols show rotational velocities and kinematic position angles from kinemetry on SLUGGS data (Foster et al. 2016). These agree within errors with the Vrot and PAkin values measured from Atlas3D. ePN.S values also agree within errors except for the first PN velocity point at 70 arcsec, where the PN systematically underestimate the mean velocity (Pulsoni et al. 2018, Sect. 7.2). In the radial range marked with vertical lines, we therefore use the Vrot(a) and PAkin(a) profiles from SLUGSS, and Vs3(a) and Vc3(a) from the linear interpolation of the values fitted on the Atlas3D and ePN.S velocity fields. Bottom: the two-dimensional rotation velocity field of NGC1023 reconstructed from Atlas3D, SLUGGS, and ePN.S., using Eq. (1). The velocity field is rotated so that the photometric major axis (PAphot = 83.3 deg) is horizontal. The final mean velocity field is given by the Atlas3D data in the center (within the black square), the reconstructed two-dimensional field from SLUGGS at intermediate radii (within the black ellipse), and the ePN.S data at large radii. The PN positions are highlighted by open black circles.
Current usage metrics show cumulative count of Article Views (full-text article views including HTML views, PDF and ePub downloads, according to the available data) and Abstracts Views on Vision4Press platform.
Data correspond to usage on the plateform after 2015. The current usage metrics is available 48-96 hours after online publication and is updated daily on week days.
Initial download of the metrics may take a while.