Fig. 5
Download original image
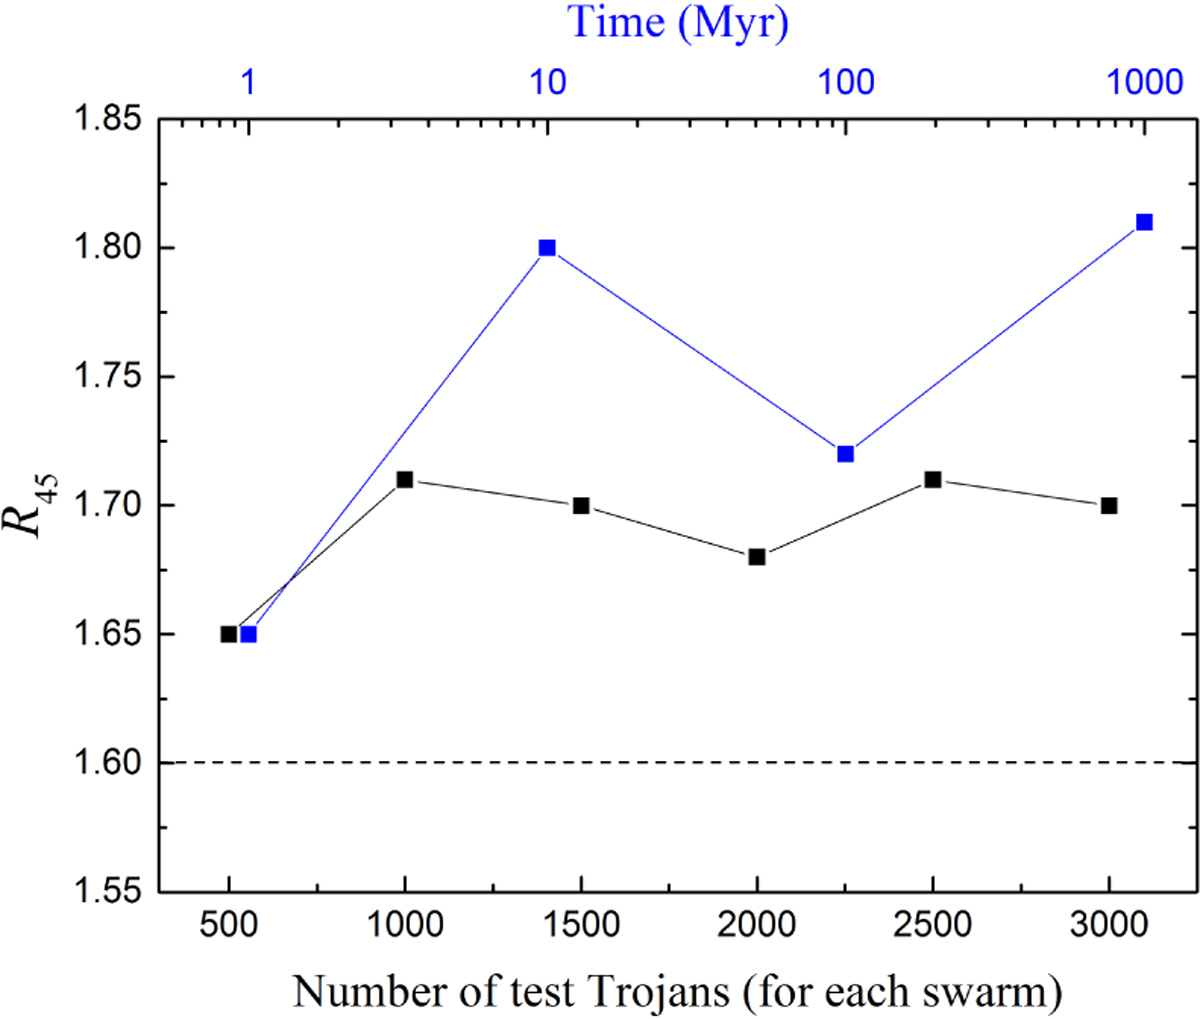
For the case of ΔaJ = 0.12 in Table 1 (highlighted in bold), the variation of the L4-to-L5 number ratio R45 with larger numbers of test Trojans for each swarm (black curve) and longer integration times (blue curve). For reference, a horizontal dashed line is plotted at R45 = 1.6, which corresponds to the unbiased number asymmetry of Jupiter Trojans.
Current usage metrics show cumulative count of Article Views (full-text article views including HTML views, PDF and ePub downloads, according to the available data) and Abstracts Views on Vision4Press platform.
Data correspond to usage on the plateform after 2015. The current usage metrics is available 48-96 hours after online publication and is updated daily on week days.
Initial download of the metrics may take a while.