Fig. 6
Download original image
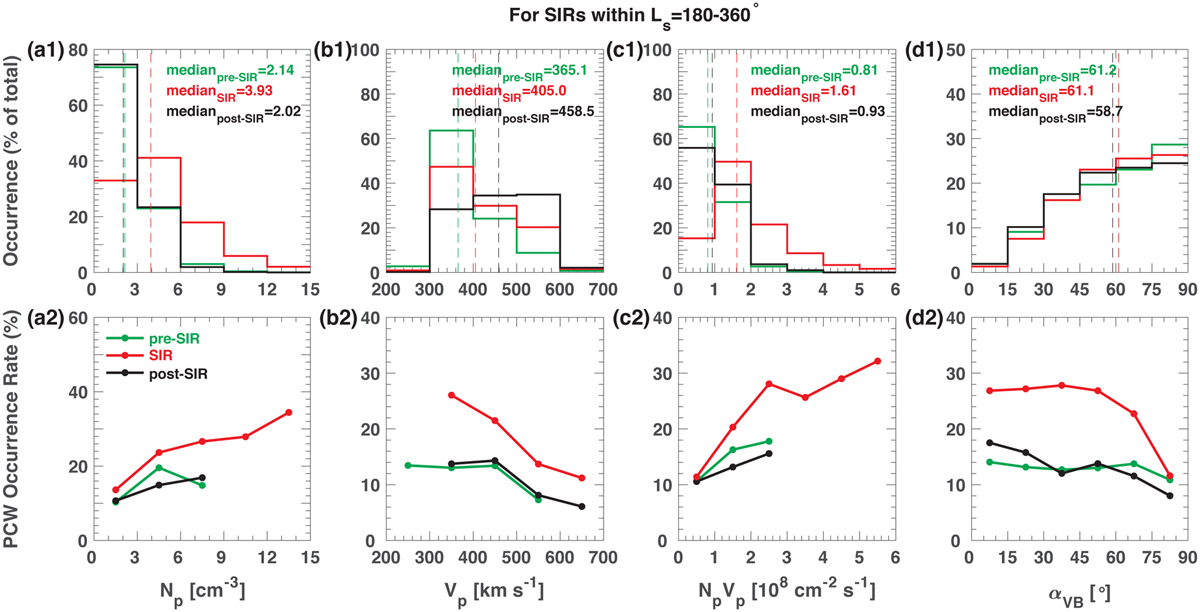
Distributions of solar wind conditions and PCW occurrence rates. Top: comparison of distributions of upstream solar wind parameters during the pre-SIR, SIR, and post-SIR phases. The vertical dashed lines represent the median values. Bottom: comparison of PCW occurrence rates during the pre-SIR, SIR, and post-SIR phases, shown as a function of upstream solar wind parameters. Note that the PCW occurrence rates for some bins are not shown because the number of the sampled points falling within the bins is very small. The panels give (al and a2) proton density (Np), (b1 and b2) proton bulk velocity (Vp), (c1 and c2) proton flux (NPVP), and (d1 and d2) IMF cone angle (αvb) for SIRs within Ls = 180°–360º.
Current usage metrics show cumulative count of Article Views (full-text article views including HTML views, PDF and ePub downloads, according to the available data) and Abstracts Views on Vision4Press platform.
Data correspond to usage on the plateform after 2015. The current usage metrics is available 48-96 hours after online publication and is updated daily on week days.
Initial download of the metrics may take a while.