Fig. 3
Download original image
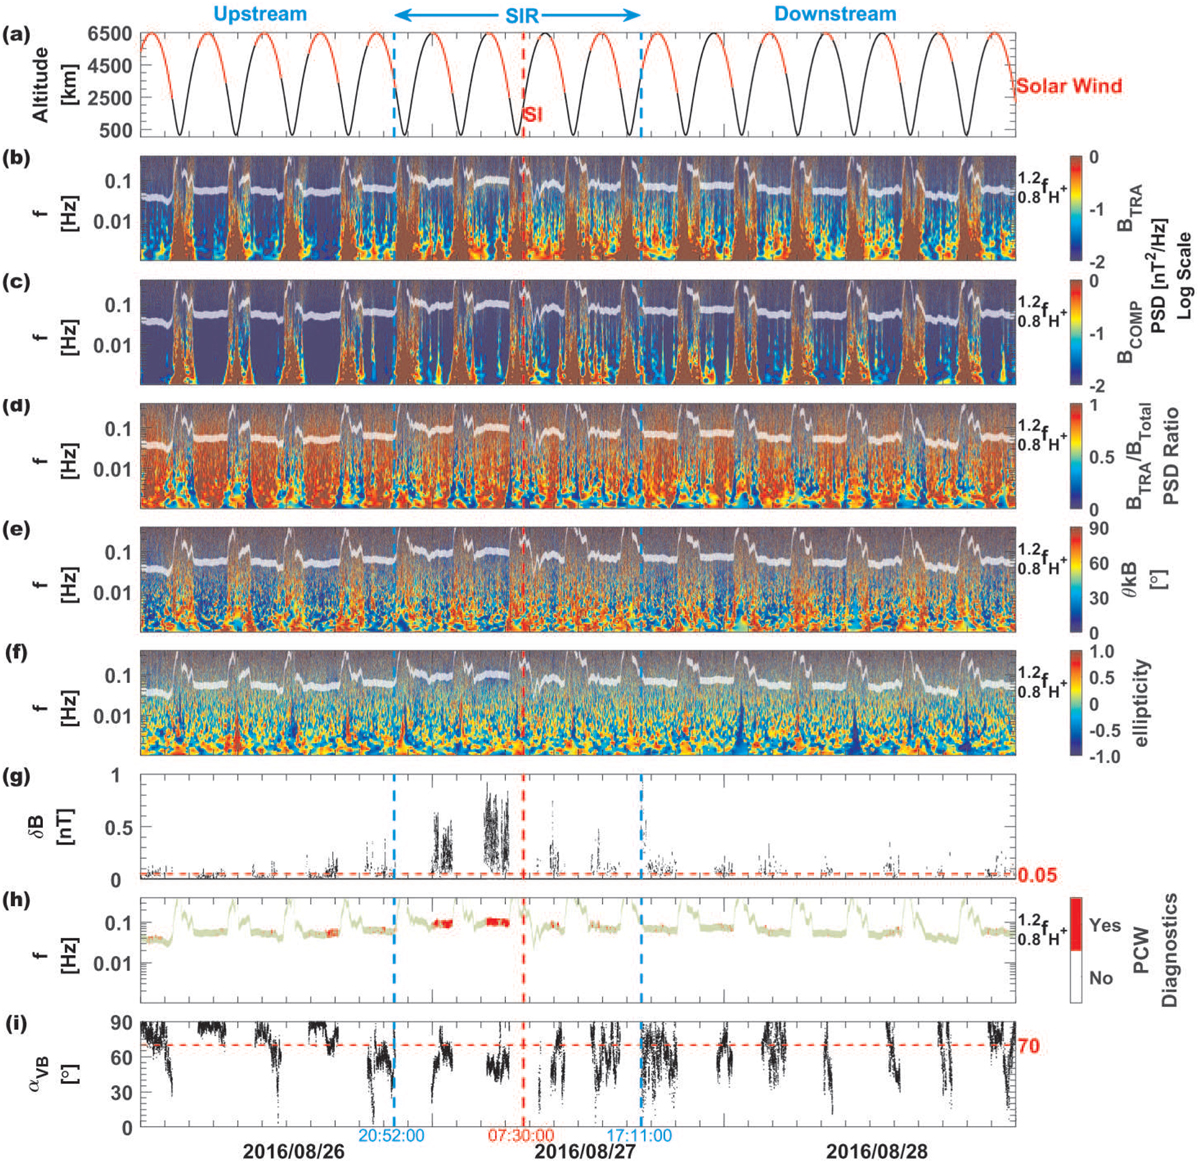
Identification of PCWs at Mars during the passage of an SIR (No. 23 SIR in Table A.1) and its upstream and downstream regions. From top to bottom: (a) MAVEN spacecraft altitude, (b) PSD of the transverse magnetic field component (BTRA), (c) PSD of the compressional magnetic field component (BCOMP), (d) BTRA to total PSD ratio, (e) wave propagation angle (θkB), (f) ellipticity (−1/+1 = LH/RH circular polarization), (g) wave amplitude (δB), (h) PCW diagnostics (“Yes” or “No” signifies a presence or absence of PCWs, respectively), and (i) IMF cone angle (αVB). Two vertical dashed blue lines delimit the SIR. The white-shaded regions in panels (b)–(f) and the light green-shaded region in panel (h) mark the frequency range from 0.8ƒH+ to 1.2ƒH+.
Current usage metrics show cumulative count of Article Views (full-text article views including HTML views, PDF and ePub downloads, according to the available data) and Abstracts Views on Vision4Press platform.
Data correspond to usage on the plateform after 2015. The current usage metrics is available 48-96 hours after online publication and is updated daily on week days.
Initial download of the metrics may take a while.