Open Access
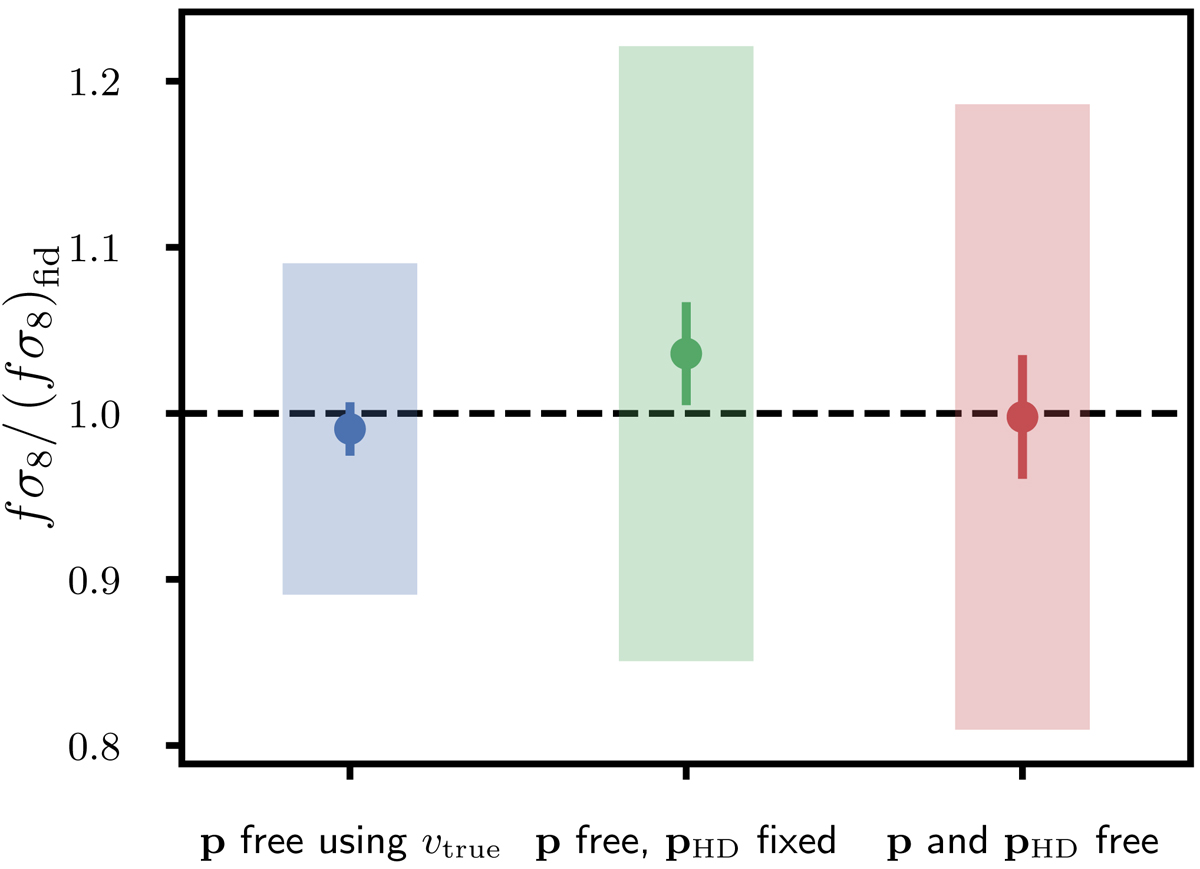
Fig. 8.
Download original image
Best fit fσ8 for the “complete sample” within a redshift range of zobs ∈ [0.02, 0.06]. The points with errorbars show the mean obtained with our 27 mocks, the colored boxes show the averages of uncertainties.
Current usage metrics show cumulative count of Article Views (full-text article views including HTML views, PDF and ePub downloads, according to the available data) and Abstracts Views on Vision4Press platform.
Data correspond to usage on the plateform after 2015. The current usage metrics is available 48-96 hours after online publication and is updated daily on week days.
Initial download of the metrics may take a while.