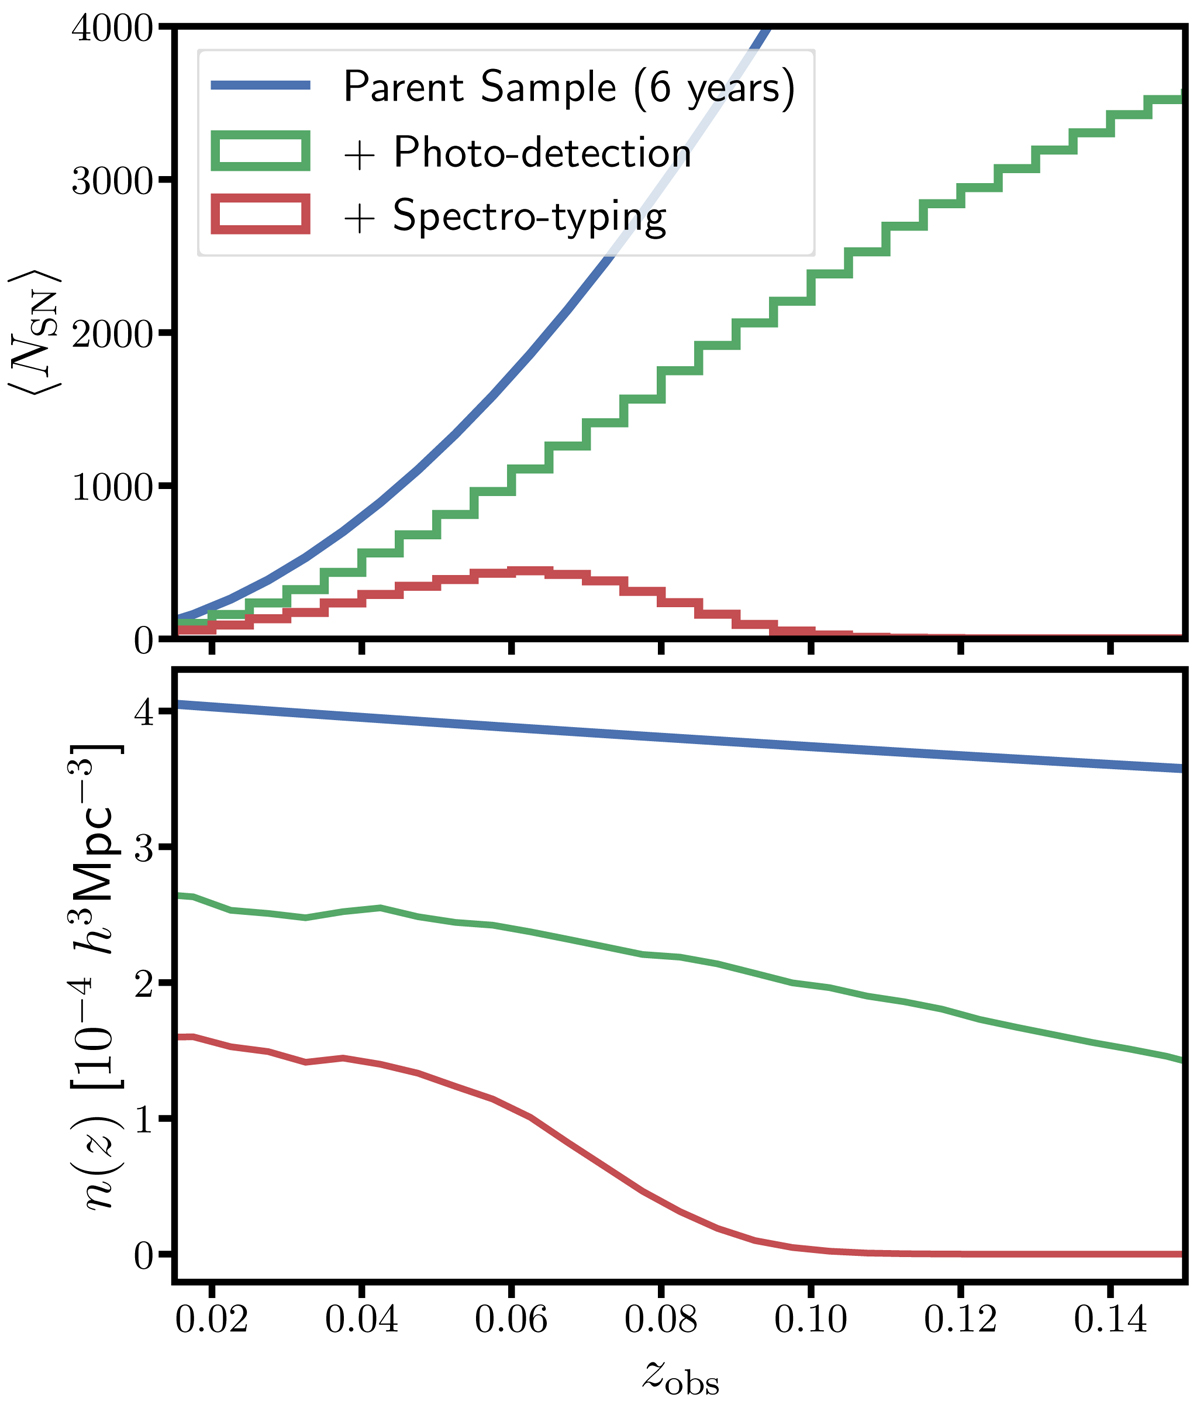
Fig. 4.
Download original image
Number and density distributions of SNe Ia with respect to redshift. The parent sample of simulated SNe Ia is shown in blue, those detected in photometry are shown in green and those successfully typed with spectroscopy are shown in red. Top panel: number of simulated ZTF type-Ia supernova versus redshift per bins of Δzobs = 0.005, averaged over 27 independent mock realizations of a 6-year program. Bottom panel: comoving number density of SNe Ia versus redshift, calculated assuming the fiducial cosmology from Table 1.
Current usage metrics show cumulative count of Article Views (full-text article views including HTML views, PDF and ePub downloads, according to the available data) and Abstracts Views on Vision4Press platform.
Data correspond to usage on the plateform after 2015. The current usage metrics is available 48-96 hours after online publication and is updated daily on week days.
Initial download of the metrics may take a while.