Fig. 3.
Download original image
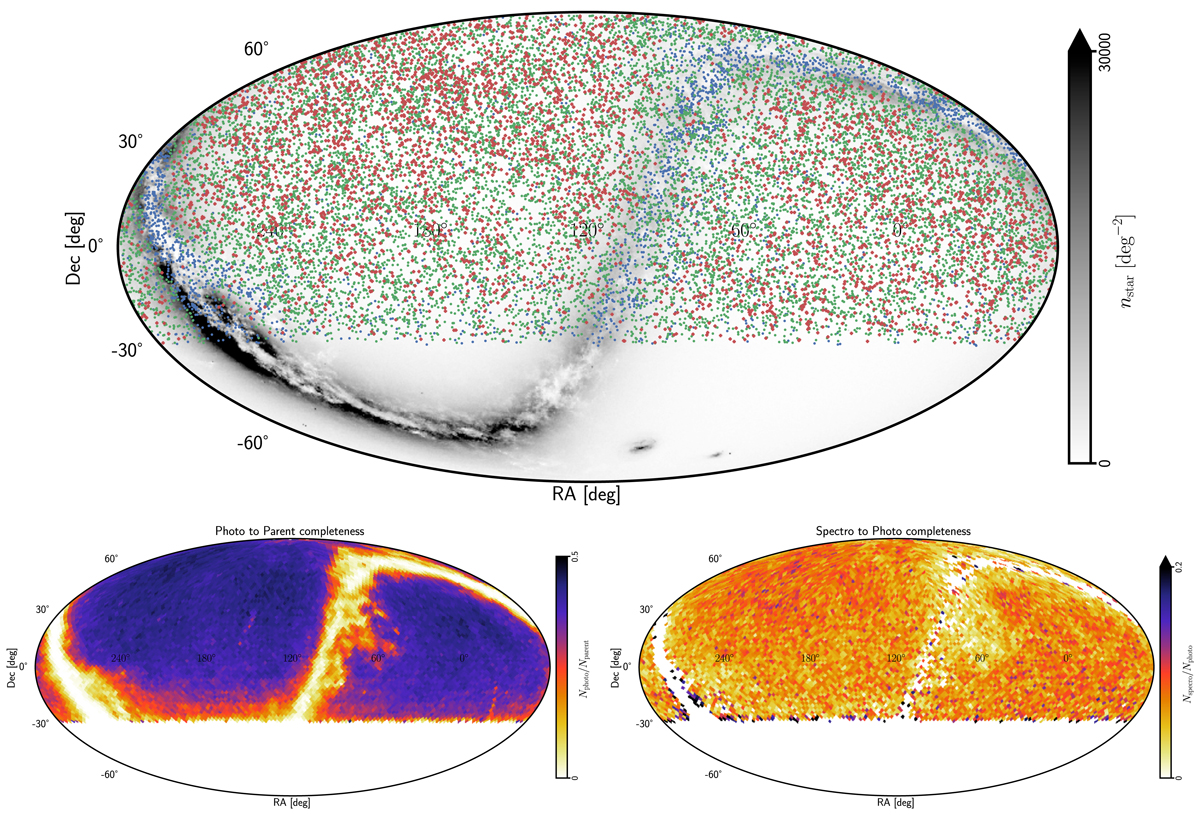
Angular distribution and completeness of the simulated ZTF SN Ia sample. Top: angular distribution of simulated ZTF type-Ia supernova from one mock realization of a 6-year program. The parent sample of simulated SNe Ia is shown in blue, those detected in photometry are shown in green and those successfully typed with spectroscopy are shown in red. A map of stellar density from the Gaia satellite is shown in the background. Bottom: angular completeness of photometric (left) and spectroscopic samples (right). The photometric completeness is computed relative to the parent sample while the spectroscopic one is relative to those detected in photometry, using the full redshift range of the simulation, that is 0 < z < 0.14. Different ranges are used for the color scales.
Current usage metrics show cumulative count of Article Views (full-text article views including HTML views, PDF and ePub downloads, according to the available data) and Abstracts Views on Vision4Press platform.
Data correspond to usage on the plateform after 2015. The current usage metrics is available 48-96 hours after online publication and is updated daily on week days.
Initial download of the metrics may take a while.