Fig. A.3.
Download original image
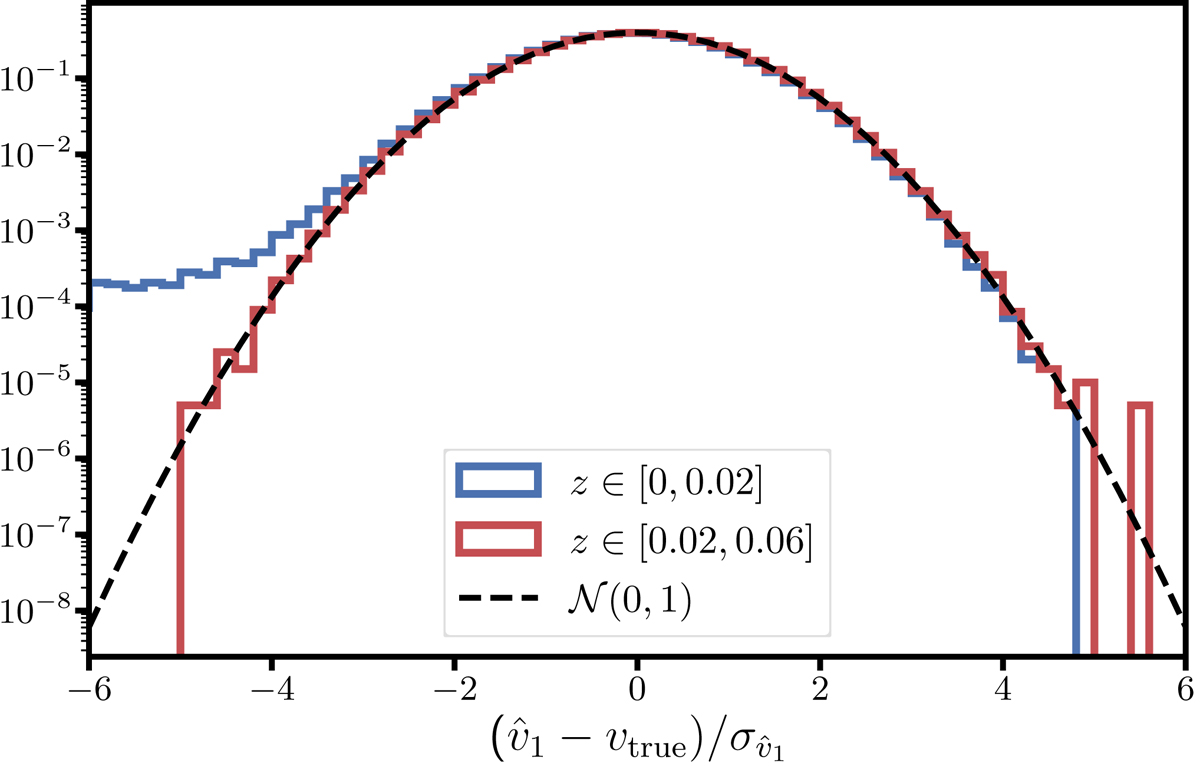
Pull of peculiar velocity estimator for ![]() on a "toy model" drawing N = 106 SNe Ia. The blue line represents the pull for SNe Ia in the redshift range [0, 0.02] and the red line represents the pull for SNe Ia in the redshift range [0.02, 0.06]. We see that for low redshift SNe Ia the velocity estimator deviates from Gaussianity due to peculiar velocity contamination of zobs.
on a "toy model" drawing N = 106 SNe Ia. The blue line represents the pull for SNe Ia in the redshift range [0, 0.02] and the red line represents the pull for SNe Ia in the redshift range [0.02, 0.06]. We see that for low redshift SNe Ia the velocity estimator deviates from Gaussianity due to peculiar velocity contamination of zobs.
Current usage metrics show cumulative count of Article Views (full-text article views including HTML views, PDF and ePub downloads, according to the available data) and Abstracts Views on Vision4Press platform.
Data correspond to usage on the plateform after 2015. The current usage metrics is available 48-96 hours after online publication and is updated daily on week days.
Initial download of the metrics may take a while.