Fig. 1.
Download original image
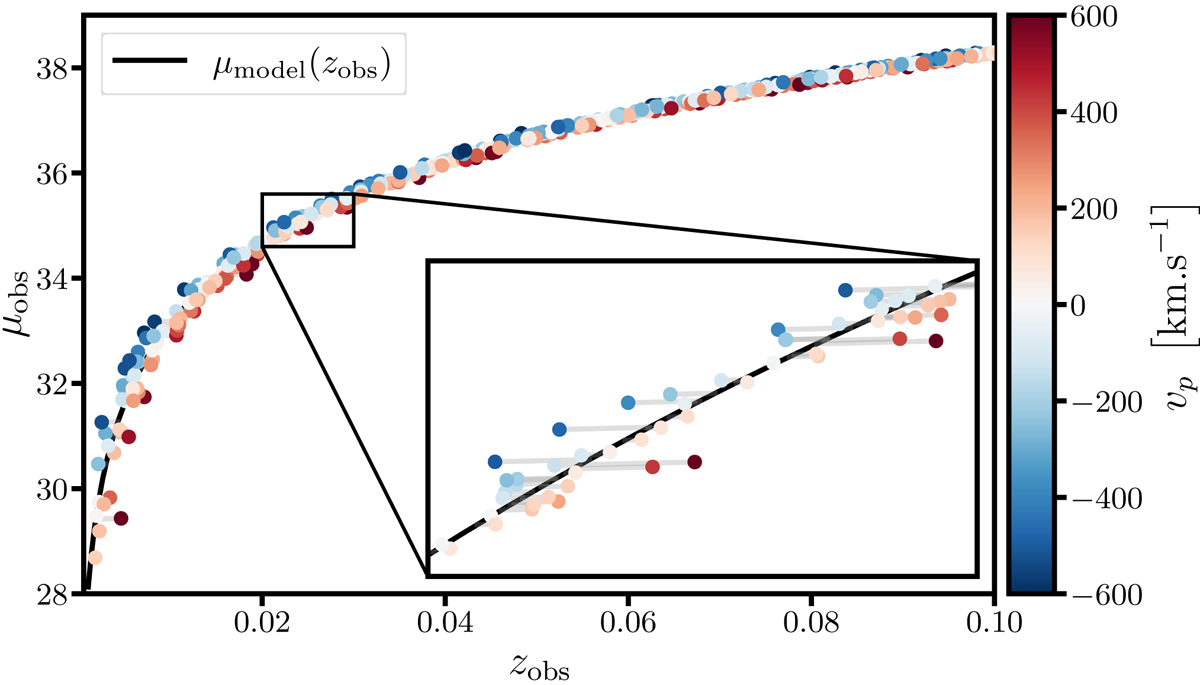
Toy model illustrating how peculiar velocities impact the observed redshift zobs and the observed distance moduli μobs. Radial peculiar velocities are randomly drawn from a Gaussian distribution with σvp = 300 km s−1. The color of each point indicates the value of its radial peculiar velocities vp. The effect on the x-axis is of first order on vp while the effect on the y-axis is of second order.
Current usage metrics show cumulative count of Article Views (full-text article views including HTML views, PDF and ePub downloads, according to the available data) and Abstracts Views on Vision4Press platform.
Data correspond to usage on the plateform after 2015. The current usage metrics is available 48-96 hours after online publication and is updated daily on week days.
Initial download of the metrics may take a while.