Open Access
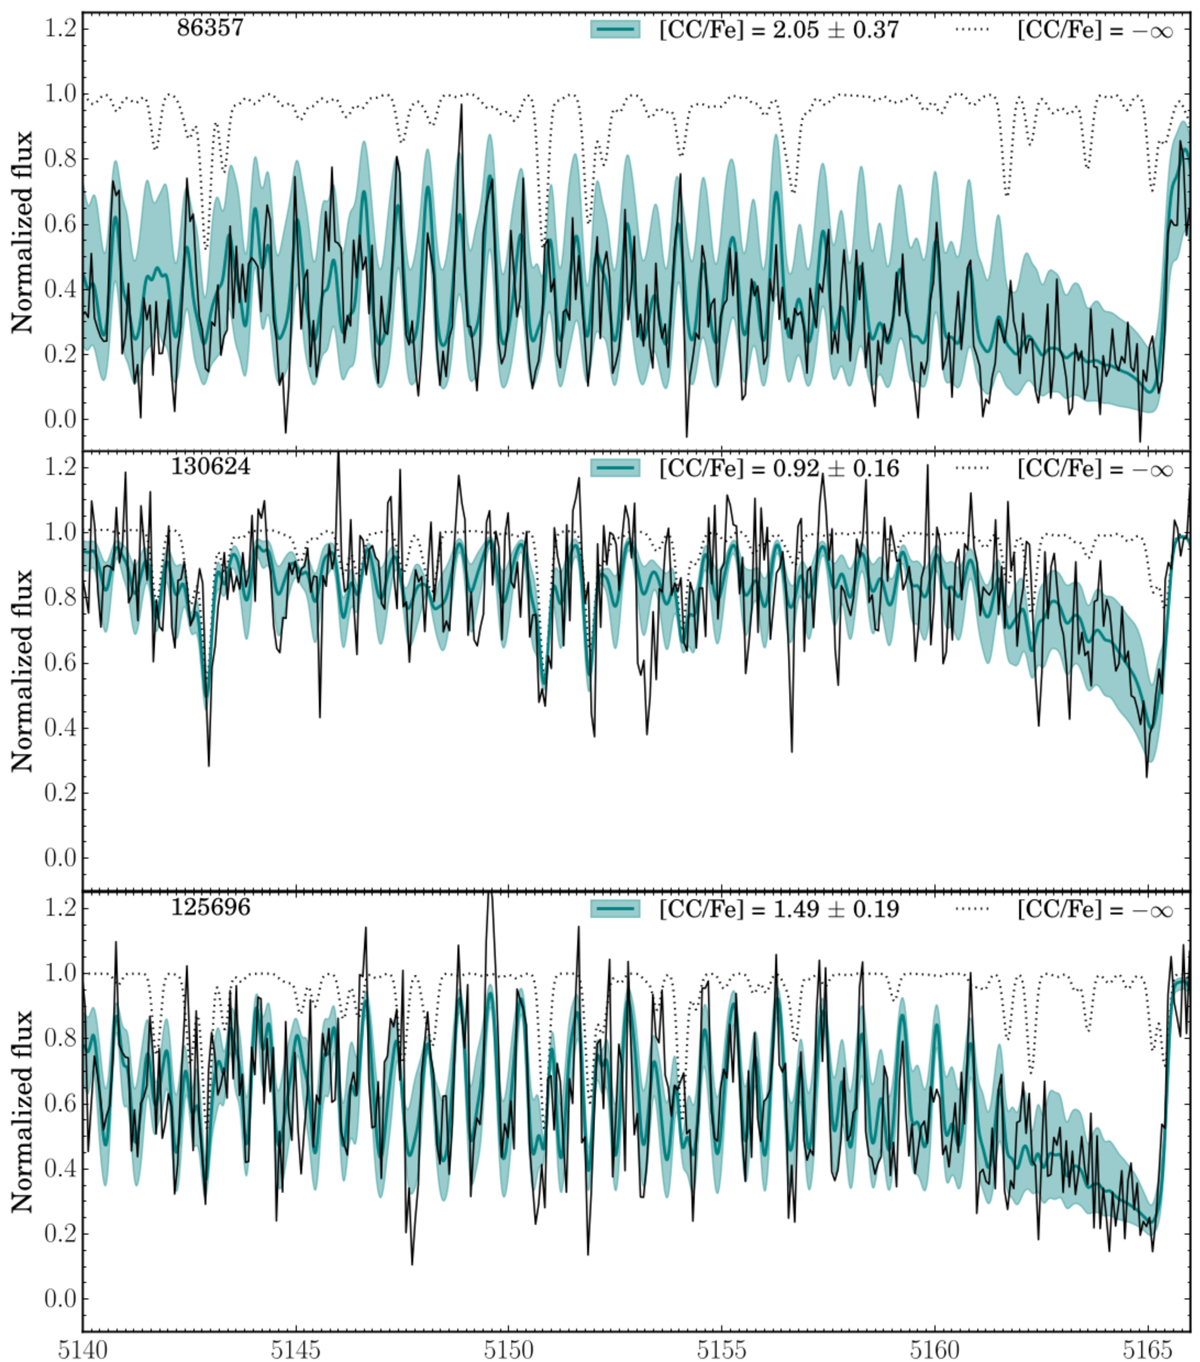
Fig. 3.
Download original image
Synthesis of the C2 band in 86357 (top), 130624 (middle), and 125696 (bottom). Each panel shows the observed spectrum (solid black line) along with a synthesis without C (dotted line), the best-fit synthesis (solid teal line), and uncertainty on the best-fit synthesis (shaded region).
Current usage metrics show cumulative count of Article Views (full-text article views including HTML views, PDF and ePub downloads, according to the available data) and Abstracts Views on Vision4Press platform.
Data correspond to usage on the plateform after 2015. The current usage metrics is available 48-96 hours after online publication and is updated daily on week days.
Initial download of the metrics may take a while.