Fig. 6
Download original image
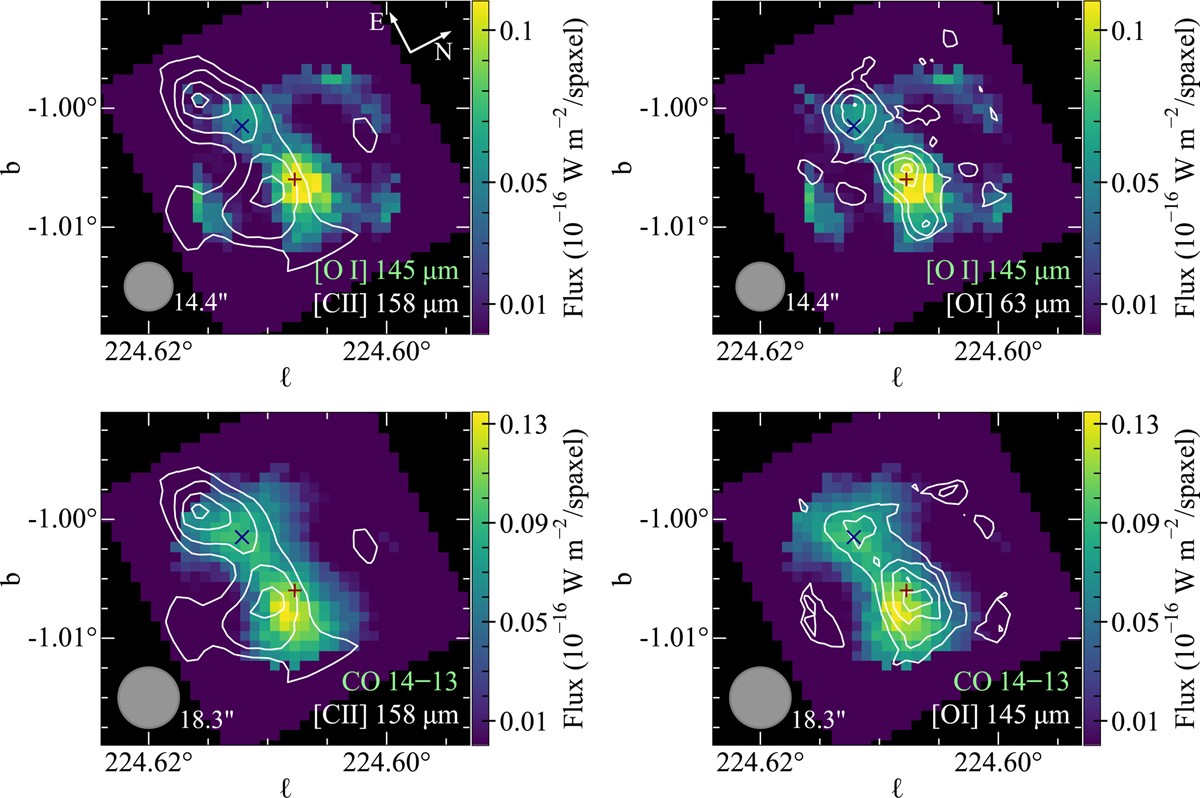
Integrated intensity maps of selected pairs of FIR lines from FIFI-LS with the top line shown in colors, and the bottom line in white contours. The contour levels are 25%, 50%, 75%, and 95% of the corresponding line emission peak. The “+” and “×” signs show the positions of the dense cores A and B, respectively. The spaxel size in the emission map of the [O I] line at 63 μm is 6″ × 6″ (blue channel) and in the map of other lines (CO 14-13, [OI] at 145 μm, and [CII] at 157.7 μm) is 12″ × 12″ (red channel). Gray circles show the beam size for each color map.
Current usage metrics show cumulative count of Article Views (full-text article views including HTML views, PDF and ePub downloads, according to the available data) and Abstracts Views on Vision4Press platform.
Data correspond to usage on the plateform after 2015. The current usage metrics is available 48-96 hours after online publication and is updated daily on week days.
Initial download of the metrics may take a while.