Fig. 3
Download original image
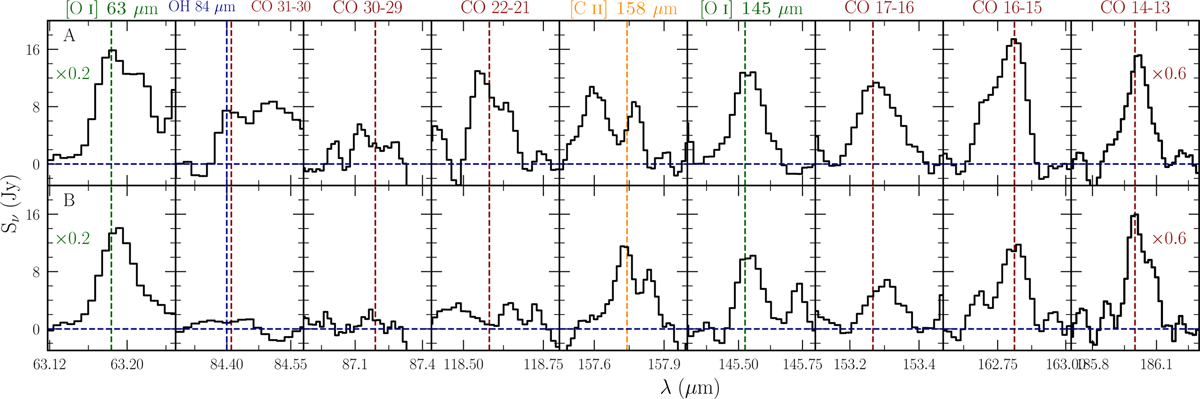
SOFIA FIFI-LS continuum-subtracted spectra toward the two dense cores in Gy 3–7: HIGALBM224.6079–1.0065 (source “A”) and HIGALBM224.6128–1.0013 (source “B”). The emission is extracted within a beam size of 20″ indicated by black circles in the right panel of Fig. 2. Vertical lines show the laboratory wavelengths of the detected lines. Spectra of the [OI] line at 63 μm are multiplied by a factor of 0.2 and those of the CO 14–13 line by a factor of 0.6 to better illustrate the line detections.
Current usage metrics show cumulative count of Article Views (full-text article views including HTML views, PDF and ePub downloads, according to the available data) and Abstracts Views on Vision4Press platform.
Data correspond to usage on the plateform after 2015. The current usage metrics is available 48-96 hours after online publication and is updated daily on week days.
Initial download of the metrics may take a while.