Open Access
Fig. B.2
Download original image
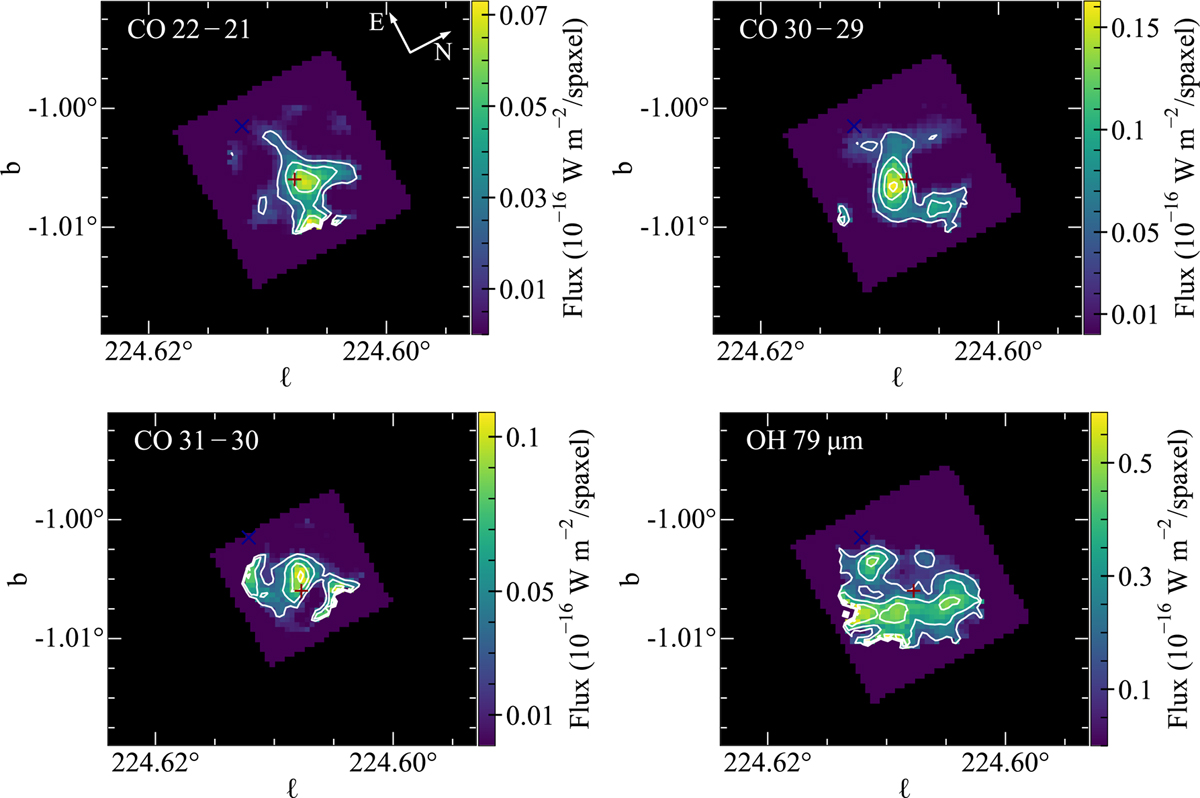
FIFI-LS integrated intensity maps of the CO 22 – 21, CO 30 – 29, and CO 31 – 30 transitions at 118, 84, and 87 μm, respectively, and the OH line at 79.2 μm. The white contours show line emission at 25%, 50%, 75%, and 95% of the corresponding line emission peak, see also Figure B.1.
Current usage metrics show cumulative count of Article Views (full-text article views including HTML views, PDF and ePub downloads, according to the available data) and Abstracts Views on Vision4Press platform.
Data correspond to usage on the plateform after 2015. The current usage metrics is available 48-96 hours after online publication and is updated daily on week days.
Initial download of the metrics may take a while.