Fig. 2
Download original image
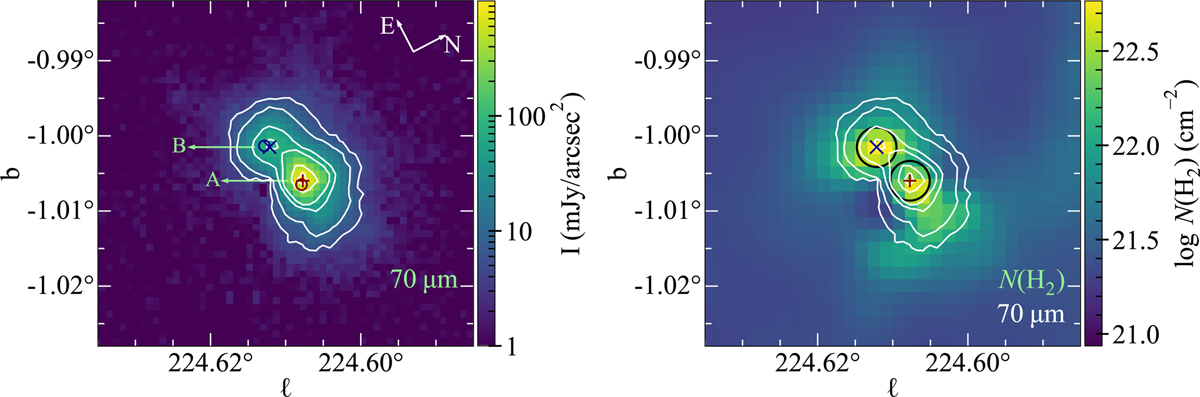
Distribution of dust continuum emission toward Gy 3–7. Left: continuum map of Gy 3–7 at 70 μm observed with Herschel/PACS. Red “+” and blue “×” symbols refer to the 70 μm continuum peaks, adopted as the positions for the dense cores A and B in the subsequent analysis. Circles show the positions of HIGALBM224.6079–1.0065 and HIGALBM224.6128–1.0013 cores from the Herschel/Hi-GAL catalog (Elia et al. 2021). Right: map of the H2 column density (NH2). Black circles with the beam size of 20″ indicate the extract regions of the SOFIA FIFI-LS spectra toward the two dense cores A and B (see more in Sect. 3.1). White contours in each map show the continuum at 70 μm, with contour levels at 5, 10, 40, 80, 400, and 800 mJy arcsec−2.
Current usage metrics show cumulative count of Article Views (full-text article views including HTML views, PDF and ePub downloads, according to the available data) and Abstracts Views on Vision4Press platform.
Data correspond to usage on the plateform after 2015. The current usage metrics is available 48-96 hours after online publication and is updated daily on week days.
Initial download of the metrics may take a while.