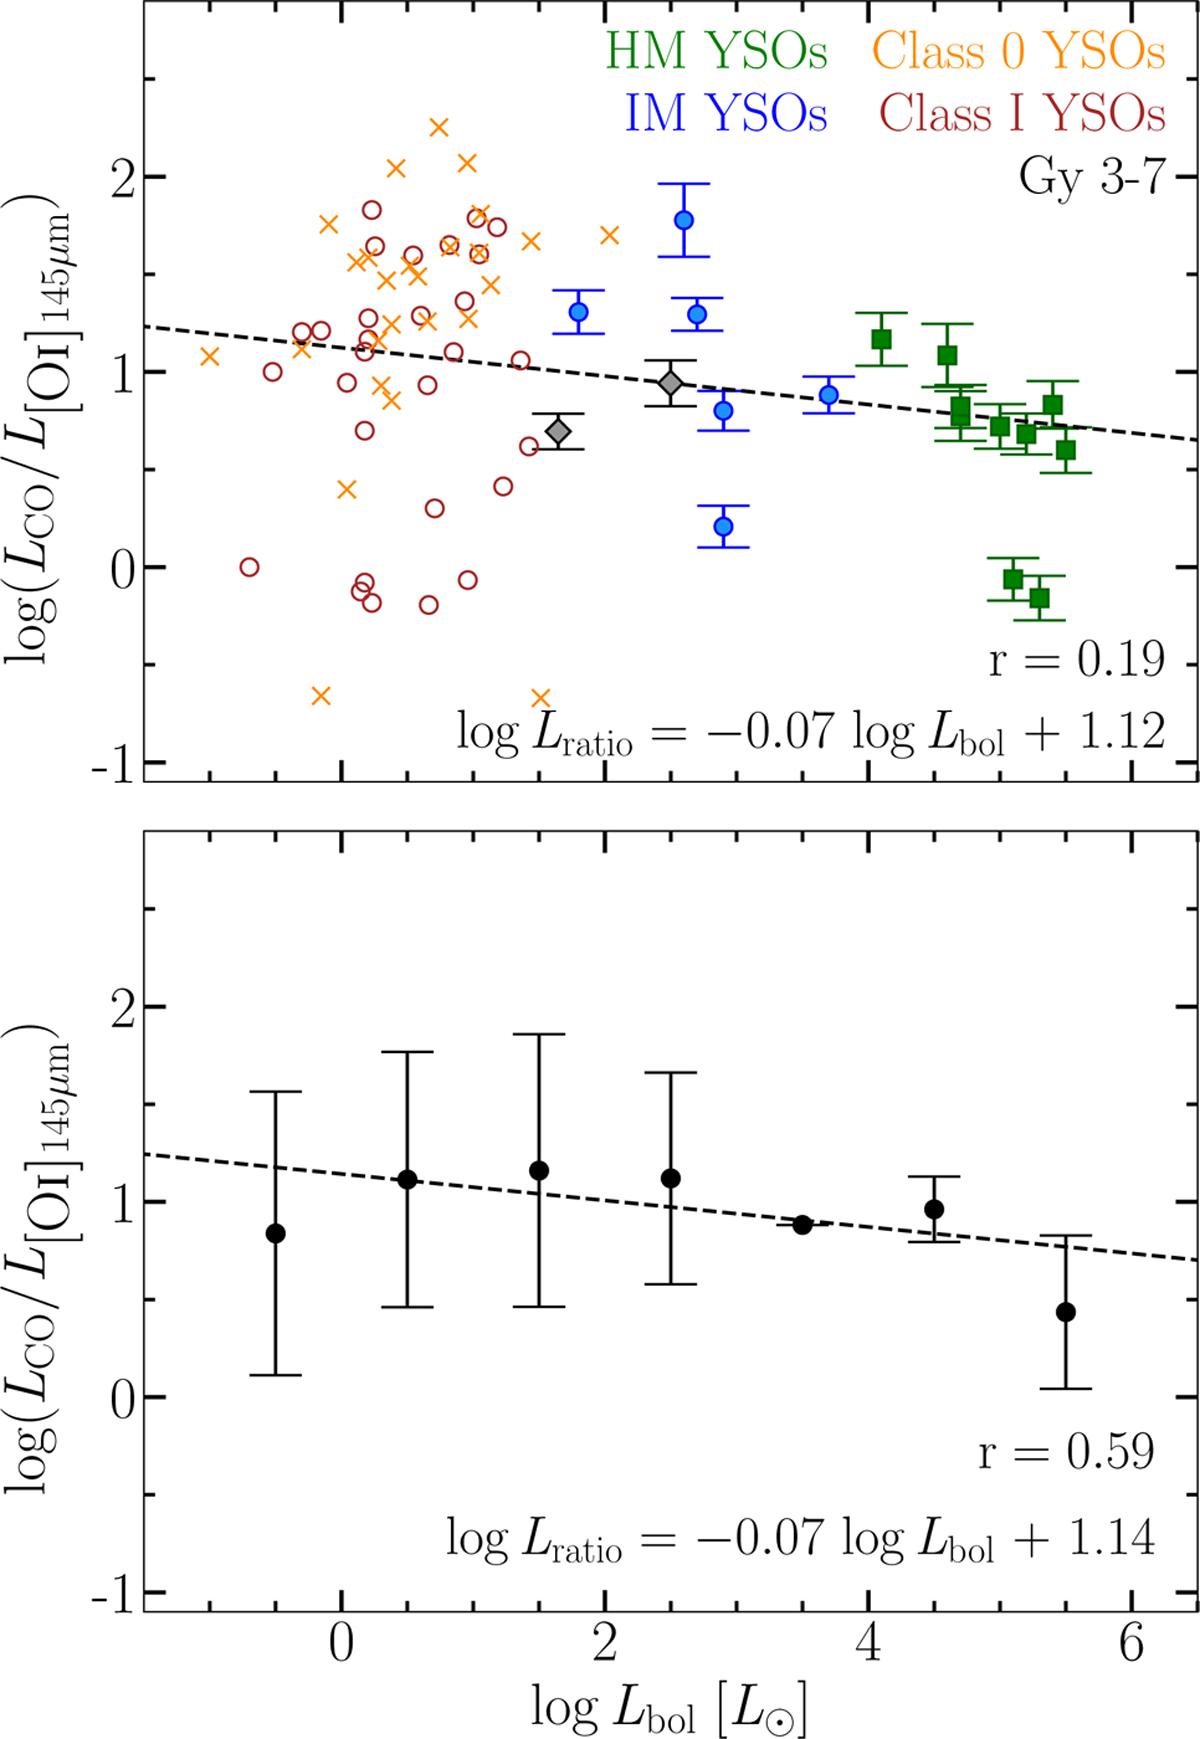
Fig. 14
Download original image
Correlations between the ratio of CO and [O I] line luminosities and bolometric luminosity of YSOs in the two cores in Gy 3–7 (gray diamonds), Class 0 and Class I YSOs (orange ‘×’ signs and red circles, respectively; Karska et al. 2018), IM YSOs (blue circles; Matuszak et al. 2015), and HM YSOs (green squares; Karska et al. 2014a). The bolometric luminosities for Gy 3–7 cores are adopted from Elia et al. (2021). The top panel shows a power-law fit to all individual data points, and the bottom panel shows the fit to the data bins (both shown as black dashed line).
Current usage metrics show cumulative count of Article Views (full-text article views including HTML views, PDF and ePub downloads, according to the available data) and Abstracts Views on Vision4Press platform.
Data correspond to usage on the plateform after 2015. The current usage metrics is available 48-96 hours after online publication and is updated daily on week days.
Initial download of the metrics may take a while.