Fig. 12
Download original image
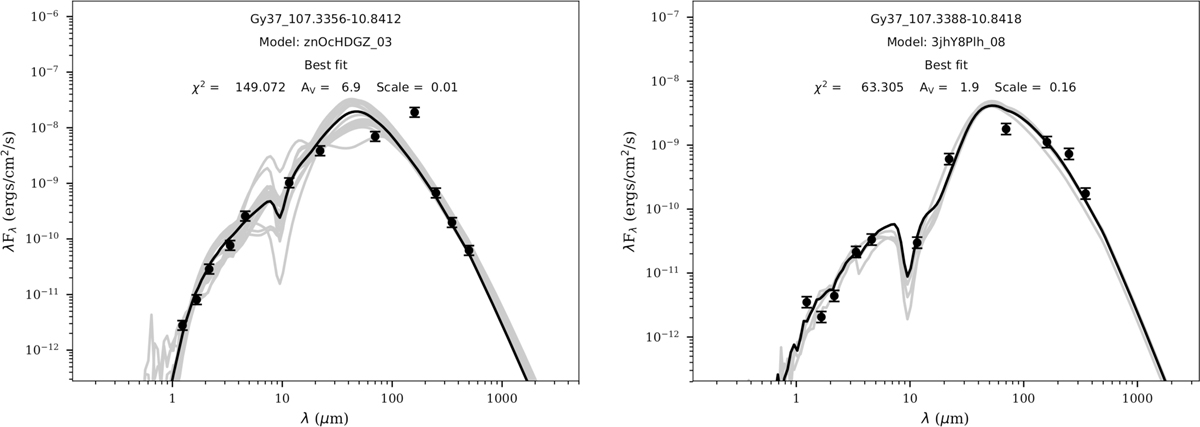
SEDs of YSOs in Gy 3-7 well-fitted with Robitaille (2017) models with envelopes. The best fit model is indicated with the black solid line and gray lines show the YSO models with χ2 between ![]() and
and ![]() , where n is the number of data points and F is a threshold parameter which we set to 3 (Sewiło et al. 2019). Filled black circles are valid flux values with uncertainties. The values of a reduced χ2 and interstellar visual extinction for the best-fit model are indicated in the plots. Appendix C shows the SEDs for the remaining YSOs in Gy 3–7.
, where n is the number of data points and F is a threshold parameter which we set to 3 (Sewiło et al. 2019). Filled black circles are valid flux values with uncertainties. The values of a reduced χ2 and interstellar visual extinction for the best-fit model are indicated in the plots. Appendix C shows the SEDs for the remaining YSOs in Gy 3–7.
Current usage metrics show cumulative count of Article Views (full-text article views including HTML views, PDF and ePub downloads, according to the available data) and Abstracts Views on Vision4Press platform.
Data correspond to usage on the plateform after 2015. The current usage metrics is available 48-96 hours after online publication and is updated daily on week days.
Initial download of the metrics may take a while.