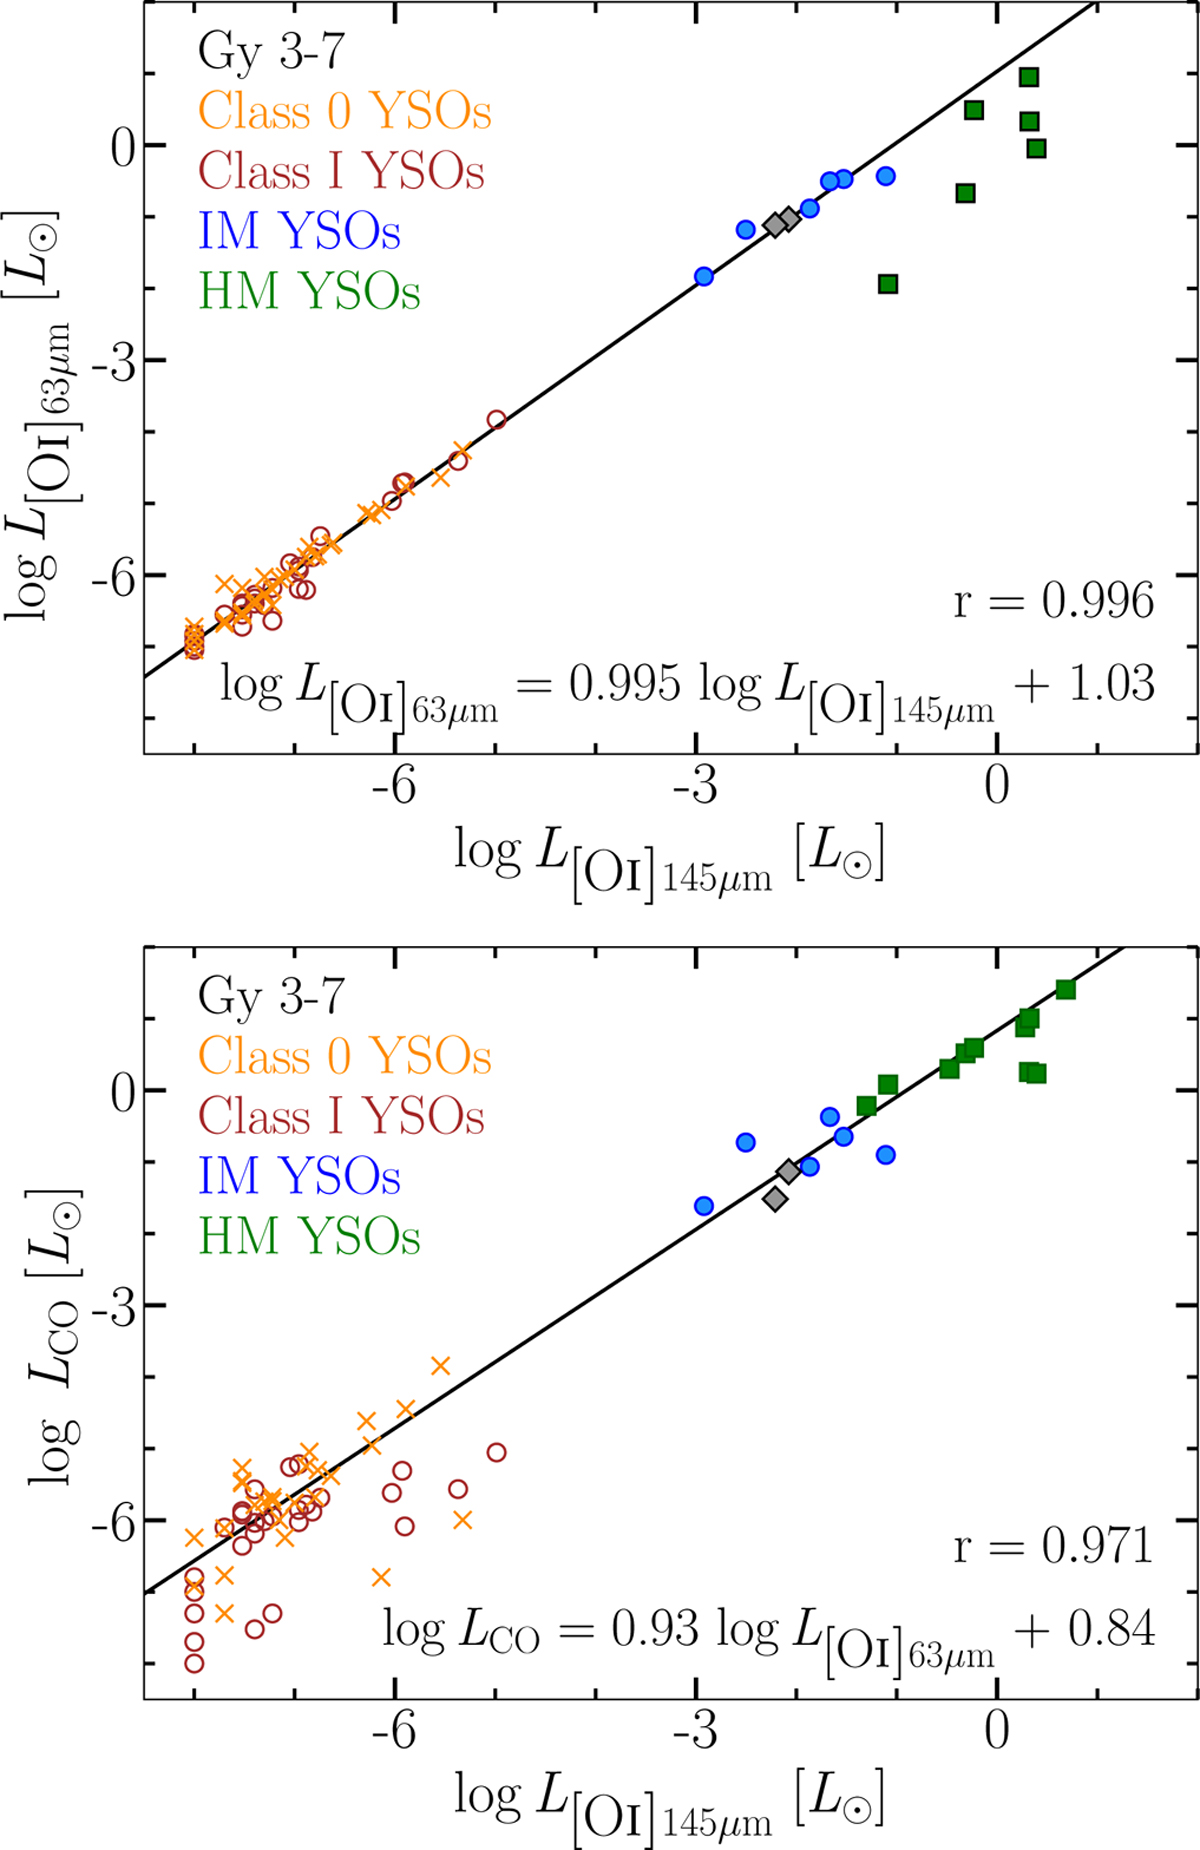
Fig. 10
Download original image
Correlations between luminosities of FIR CO and [O I] lines. Top: correlation between the luminosities of the 63 and 145 μm [O I] lines at from LM to HM YSOs. Cores A and B in Gy 3–7 are marked as grey diamonds, Class 0 and Class I YSOs as orange "×" signs and red circles (Karska et al. 2018), respectively, IM YSOs as blue circles (Matuszak et al. 2015), and HM YSOs as green squares, respectively (Karska et al. 2014a). Black solid line is the linear fit to all sources except for the HM YSOs, showing a strong correlation between the two [O I] line luminosities. Bottom: correlation between luminosities of the CO lines and the [O I] line at 145 μm. Black solid line shows the linear fit to all sources, including the HM YSOs.
Current usage metrics show cumulative count of Article Views (full-text article views including HTML views, PDF and ePub downloads, according to the available data) and Abstracts Views on Vision4Press platform.
Data correspond to usage on the plateform after 2015. The current usage metrics is available 48-96 hours after online publication and is updated daily on week days.
Initial download of the metrics may take a while.