Fig. 2.

Download original image
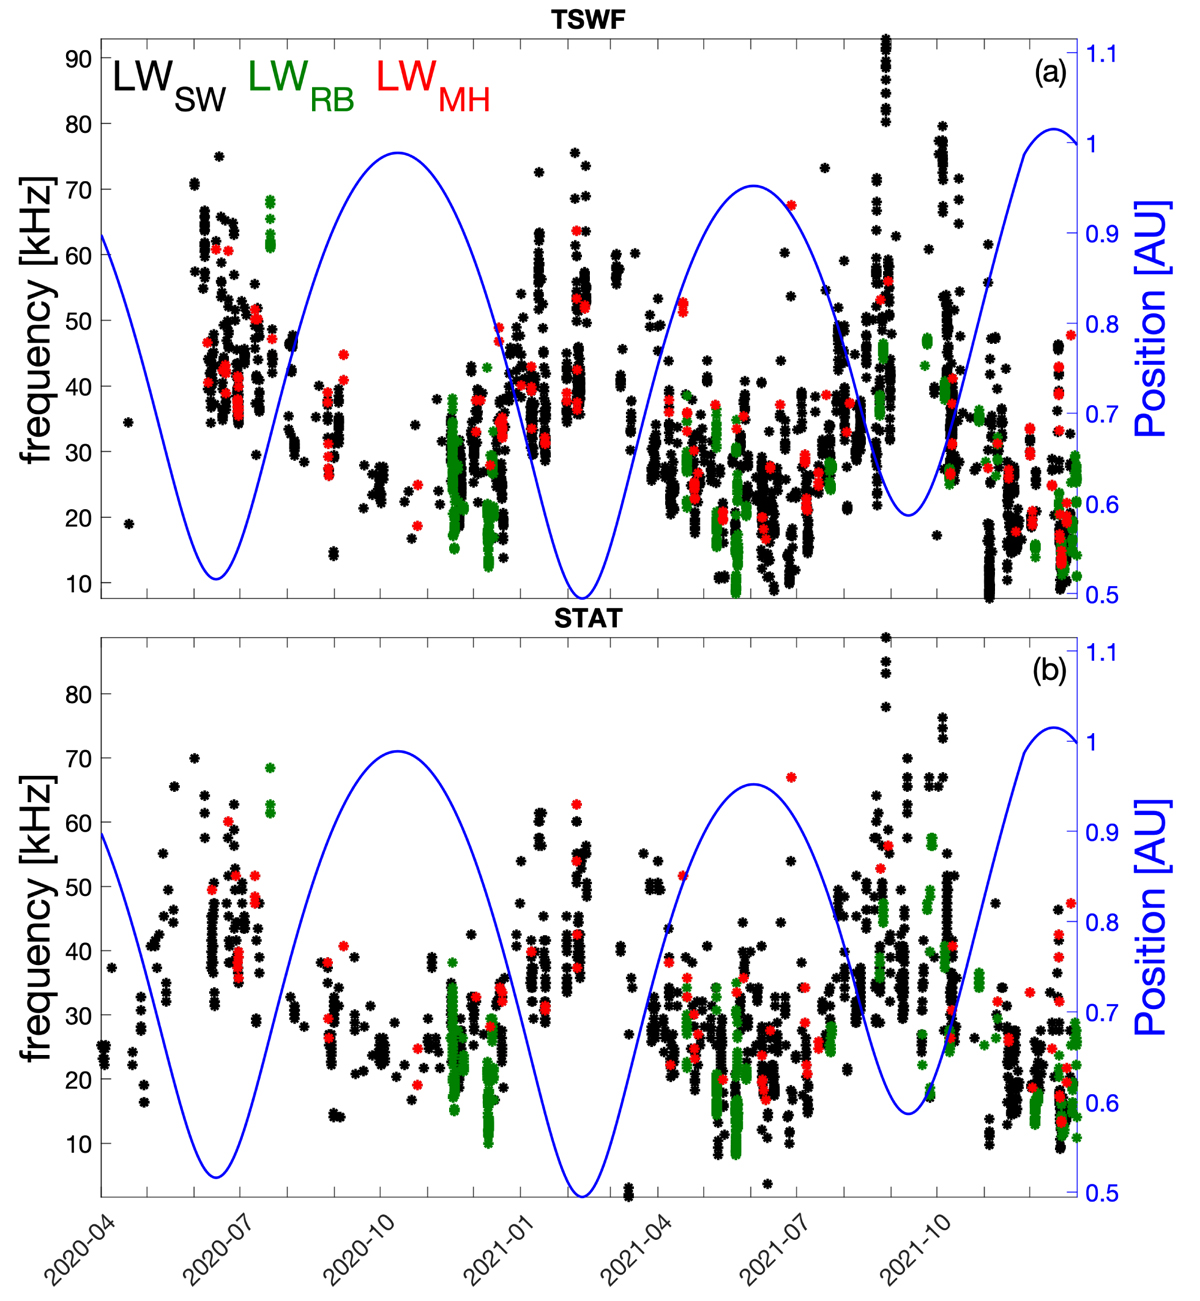
Distribution of LWs throughout Solar Orbiter’s trajectory observed by the RPW/TDS instrument. (a) TSWF data. Shown are the frequency of all triggered snapshots containing LWs captured between 2020 and 2021 (black), LWs associated with MHs (red), and LWs associated with RB source regions (green). Each circle represents a triggered snapshot that contains a LW. Solar Orbiter’s distance from the Sun is plotted for reference on the right axis (blue line). (b) STAT data. Shown are the median frequency of all STAT data packets containing LWs captured between 2020 and 2021 (black), data packets containing LWs associated with MHs (red), and data packets containing LWs associated with RB source regions (green). Each circle represents a data packet that contains between 1 and 16 LWs. Solar Orbiter’s distance from the Sun is plotted for reference on the right axis (blue line).
Current usage metrics show cumulative count of Article Views (full-text article views including HTML views, PDF and ePub downloads, according to the available data) and Abstracts Views on Vision4Press platform.
Data correspond to usage on the plateform after 2015. The current usage metrics is available 48-96 hours after online publication and is updated daily on week days.
Initial download of the metrics may take a while.


