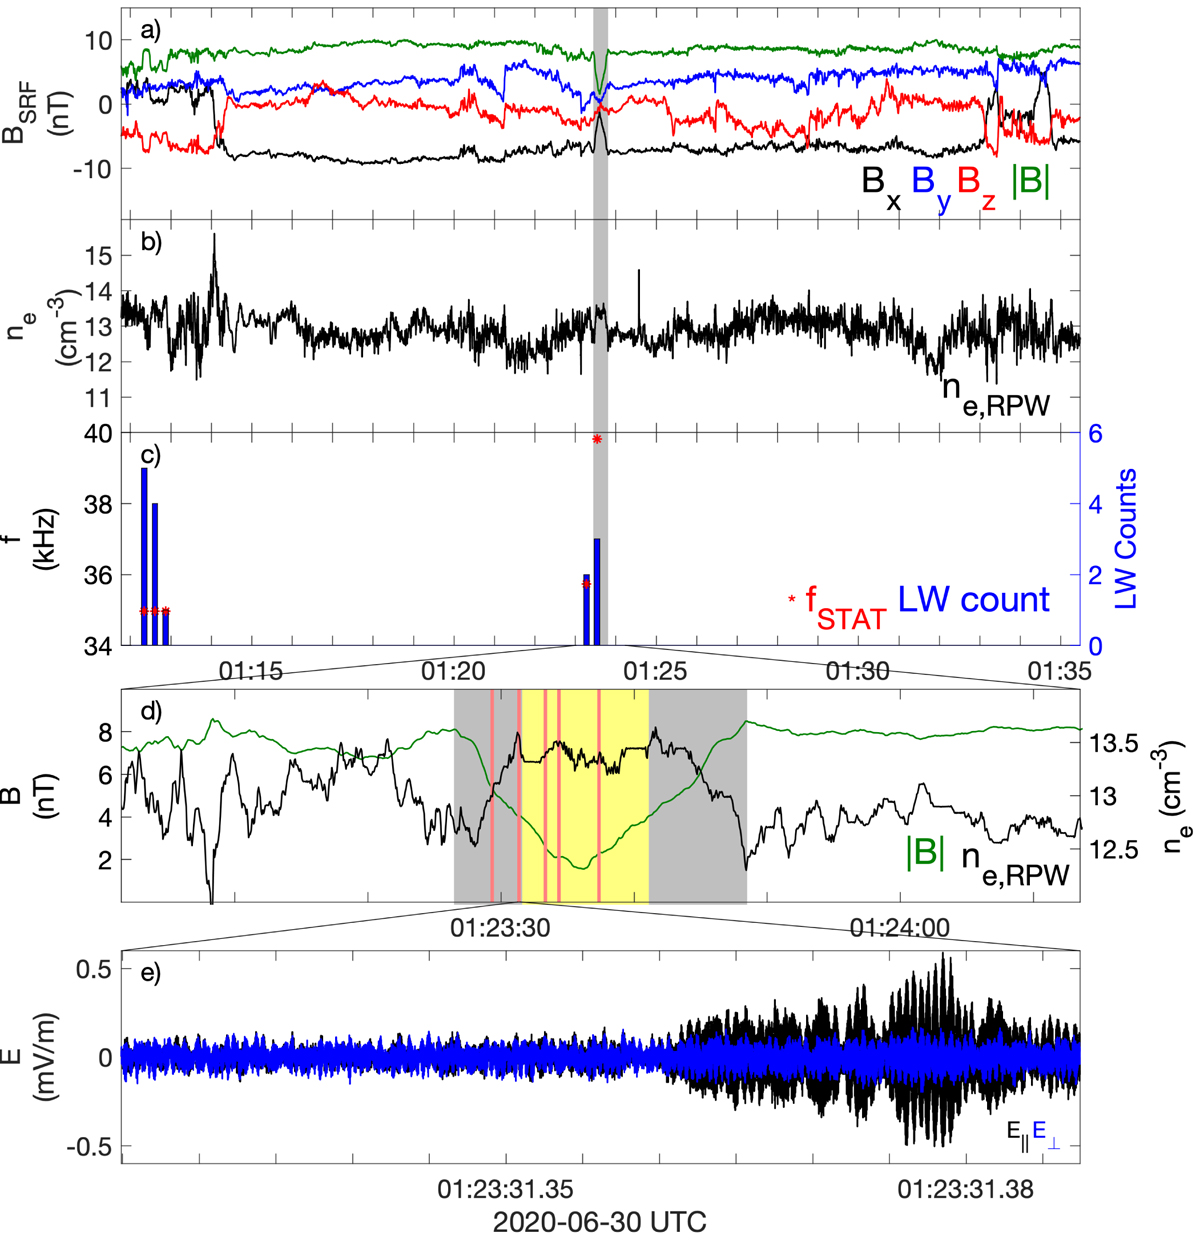
Fig. 1.

Download original image
Overview plot from Solar Orbiter’s RPW and MAG instruments around a MH. (a) Magnetic field components in SRF coordinates (black, blue, and red) and the magnetic field magnitude (green) around a MH (gray highlight). (b) Density from the spacecraft’s potential around a MH (gray highlight). (c) STAT data from the TDS onboard algorithm around a MH (gray highlight). Each bar indicates a STAT packet with at least one LW. The height of the blue bars (right axis) indicates the number of LWs in the STAT packet, and the red asterisks (left axis) are the median frequency of all the waves in that STAT packet. (d) Zoomed-in view of a MH that contains several LWs (red highlights). The density obtained from the spacecraft (s/c) potential (black) increases as the magnetic field magnitude (green) decreases, indicating that this magnetic structure is in pressure balance. The center of the MH, that is, all points where the magnetic field magnitude is less than half of the background level, is highlighted in yellow, and the MH edges are highlighted in gray. The full MH interval is the combination of the yellow and gray intervals. (e) TDS snapshot of the perpendicular (blue) and parallel (black) electric field components, showing a LW found inside a MH.
Current usage metrics show cumulative count of Article Views (full-text article views including HTML views, PDF and ePub downloads, according to the available data) and Abstracts Views on Vision4Press platform.
Data correspond to usage on the plateform after 2015. The current usage metrics is available 48-96 hours after online publication and is updated daily on week days.
Initial download of the metrics may take a while.


