Fig. 9
Download original image
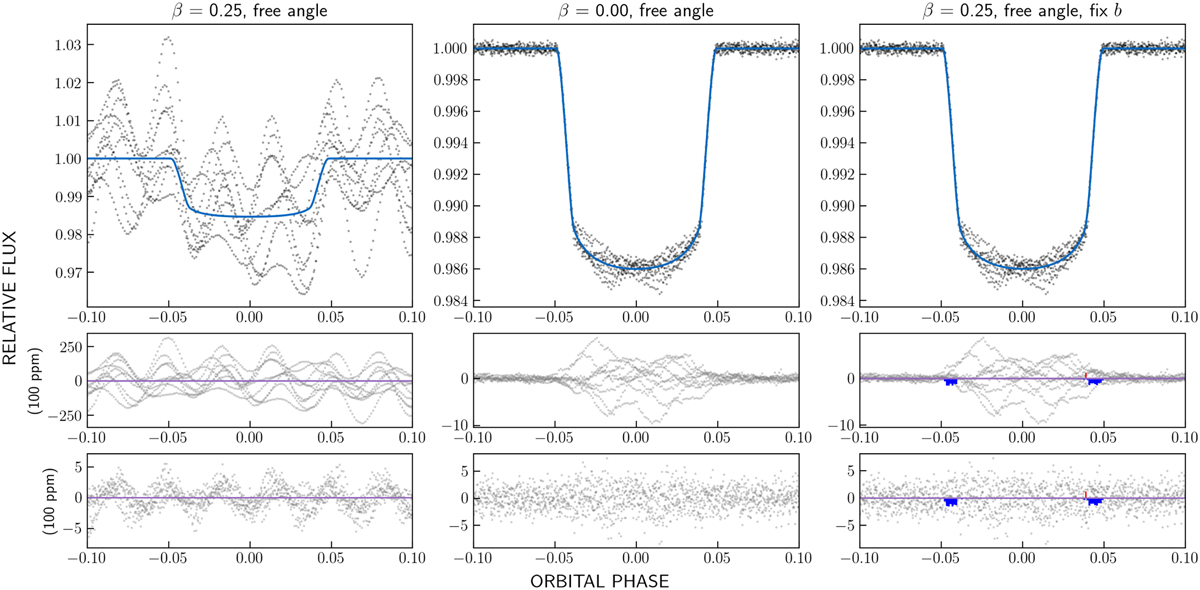
Summary of the results for the pXX cases. The structure of the figure is similar to Fig. 7, except that the left panel corresponds to a data series having all the frequencies, while on the other two columns show the ten detected frequencies were removed as sine model. Therefore, the differences between the models are only given for the latter.
Current usage metrics show cumulative count of Article Views (full-text article views including HTML views, PDF and ePub downloads, according to the available data) and Abstracts Views on Vision4Press platform.
Data correspond to usage on the plateform after 2015. The current usage metrics is available 48-96 hours after online publication and is updated daily on week days.
Initial download of the metrics may take a while.