Fig. 8
Download original image
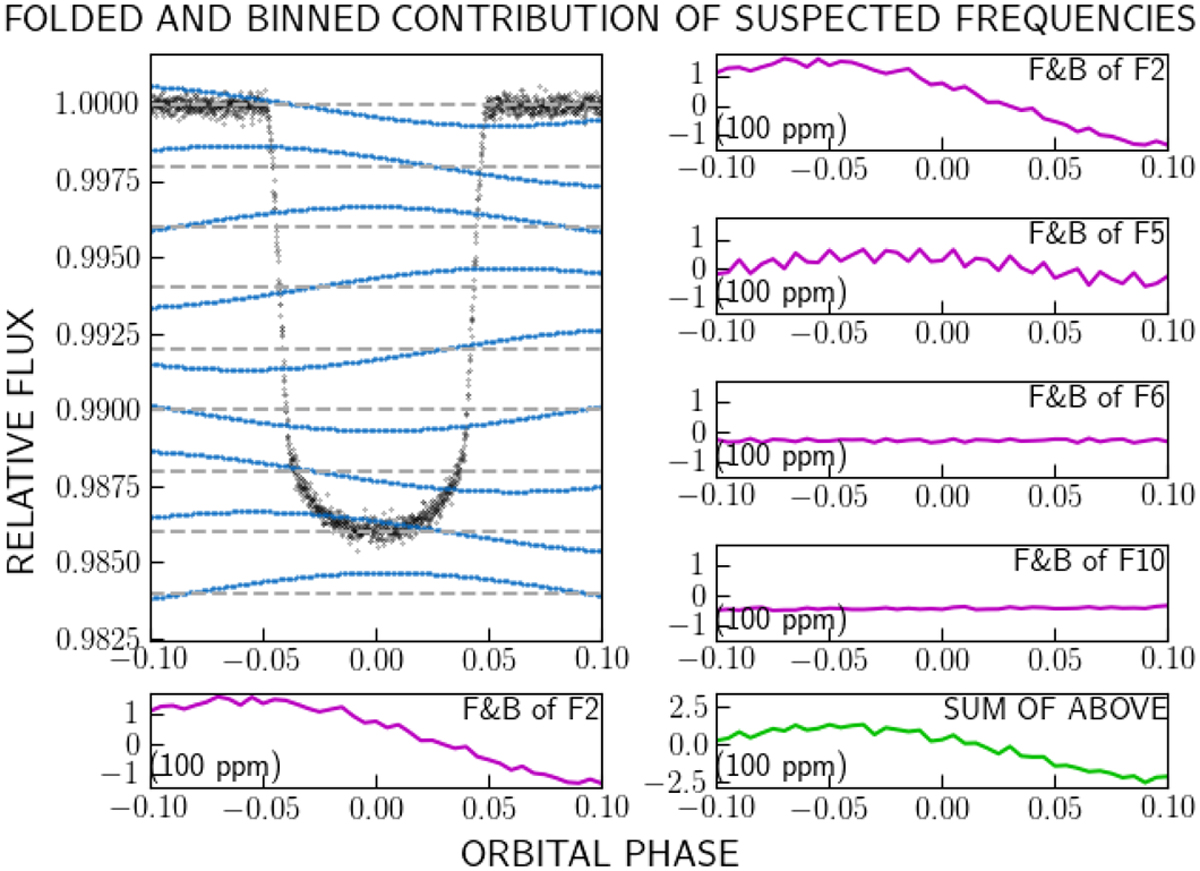
Contributions of some of the sinusoidal signals to the total flux around the transit phases. Top left: contributions of F2 around the individual transit events with blue symbols and shifted vertically from each other for a better view, overlaid on the folded transit curve. Bottom left: contribution of F2 after folding with the orbital period and binning, shown on a scale of 100 ppm. The right panels show the contributions of F2, F5, F6, and F10, as well as their sum.
Current usage metrics show cumulative count of Article Views (full-text article views including HTML views, PDF and ePub downloads, according to the available data) and Abstracts Views on Vision4Press platform.
Data correspond to usage on the plateform after 2015. The current usage metrics is available 48-96 hours after online publication and is updated daily on week days.
Initial download of the metrics may take a while.