Fig. 6
Download original image
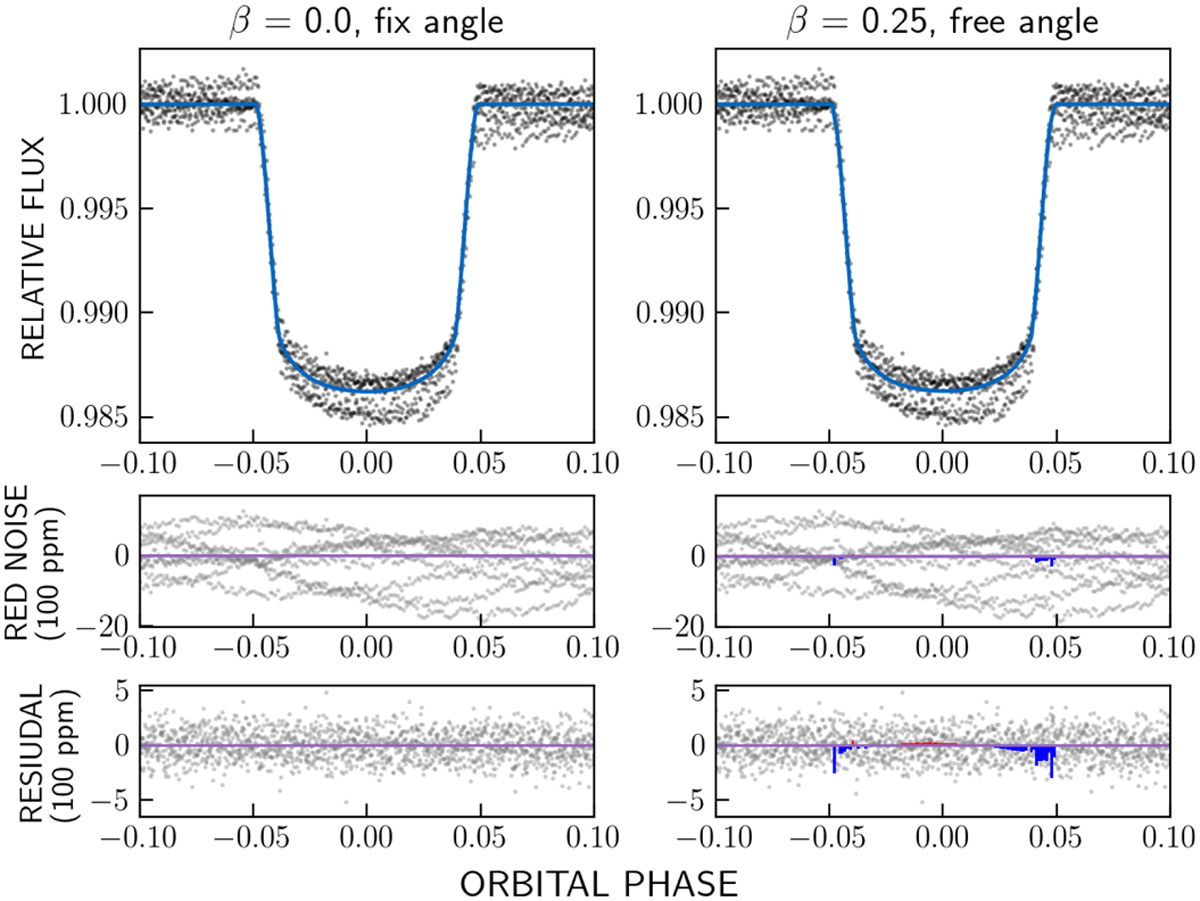
Model fits achieved for test case n00. The models are shown in the column titles. The top row shows the synthetic data with black symbols and the modelled curves with blue lines. The middle and bottom rows show the fitted red noise and the final residuals, respectively. The coloured areas show the differences between the fits of the actual model and the leftmost model (i.e. aligned, fixed angle). Red and blue correspond to positive and negative discrepancy, respectively, and the regions with no difference are coded with magenta.
Current usage metrics show cumulative count of Article Views (full-text article views including HTML views, PDF and ePub downloads, according to the available data) and Abstracts Views on Vision4Press platform.
Data correspond to usage on the plateform after 2015. The current usage metrics is available 48-96 hours after online publication and is updated daily on week days.
Initial download of the metrics may take a while.