Open Access
Fig. 5
Download original image
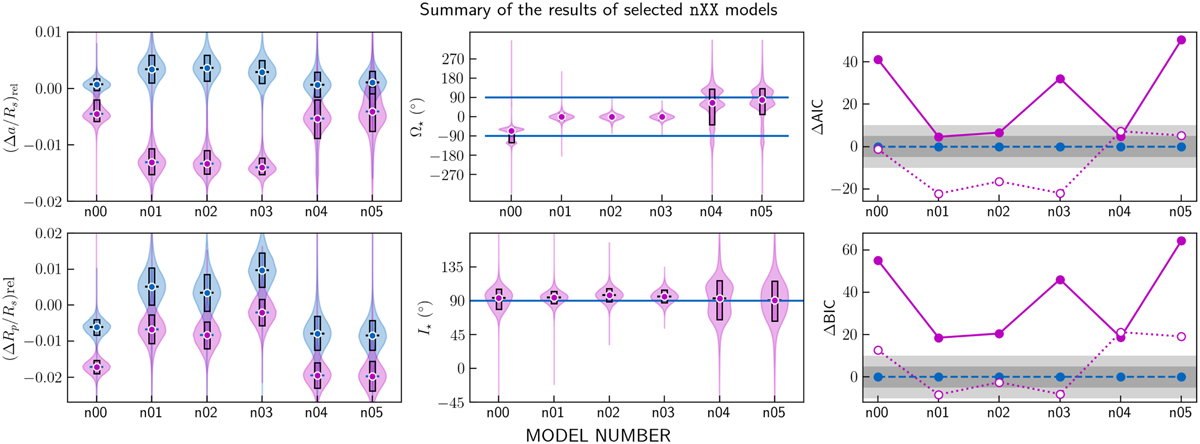
Summary of the results for the nXX cases. The structure of the figure is similar to Fig. 2, but on the left and middle panel the marginal distribution of the corresponding parameter is depicted with so called violin plot. The circles and bars are belonging to the found median values and the uncertainty ranges.
Current usage metrics show cumulative count of Article Views (full-text article views including HTML views, PDF and ePub downloads, according to the available data) and Abstracts Views on Vision4Press platform.
Data correspond to usage on the plateform after 2015. The current usage metrics is available 48-96 hours after online publication and is updated daily on week days.
Initial download of the metrics may take a while.