Fig. 3
Download original image
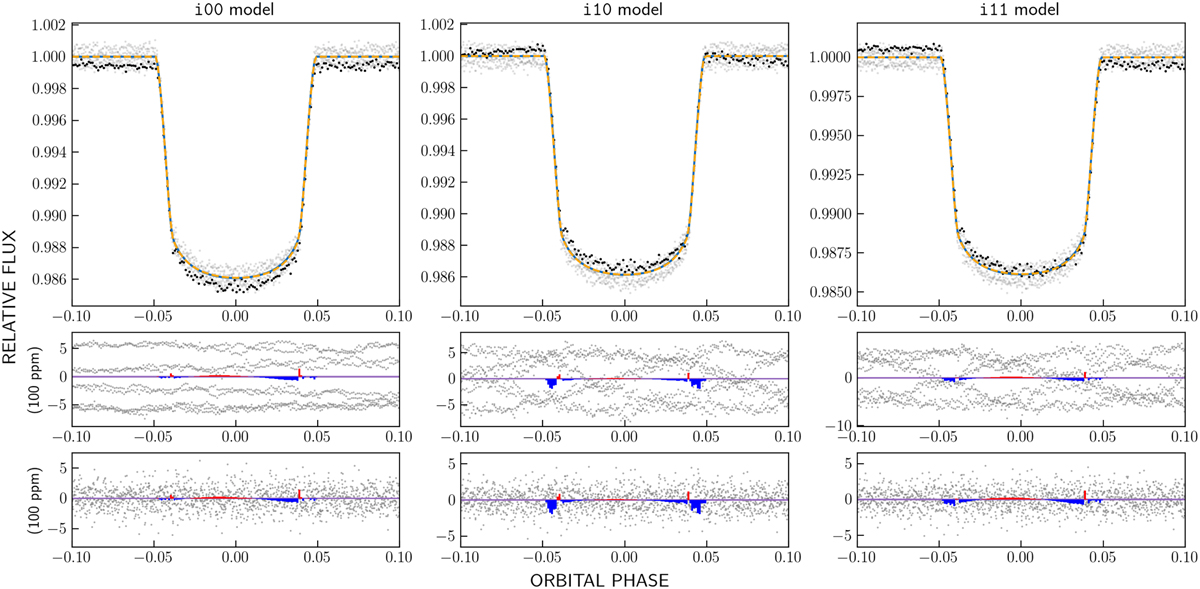
Sample fits and residuals of three simulated systems from the iXX series. Top panel: folded light curves with grey points, with simulated transit curve samples for the first orbital period, including noise and pulsation with black circles. There are also the fits of the two models: the fixed angle, β = 0 model with blue dashed line, and the free angles, β = 0.25 model with orange solid line. The two fits are virtually indistinguishable on these graphs. Middle panel: residuals in the red noise case. Bottom panel: residuals in the white noise case. The colours along the horizontal line at y = 0 encode the sign of the difference between the predicted fluxes of the fixed angles (λ = 0, I* = 90; at β = 0) and free angles (β = 0.25) models. Positive difference is shown in red, negative in blue; otherwise it is magenta.
Current usage metrics show cumulative count of Article Views (full-text article views including HTML views, PDF and ePub downloads, according to the available data) and Abstracts Views on Vision4Press platform.
Data correspond to usage on the plateform after 2015. The current usage metrics is available 48-96 hours after online publication and is updated daily on week days.
Initial download of the metrics may take a while.