Fig. 10
Download original image
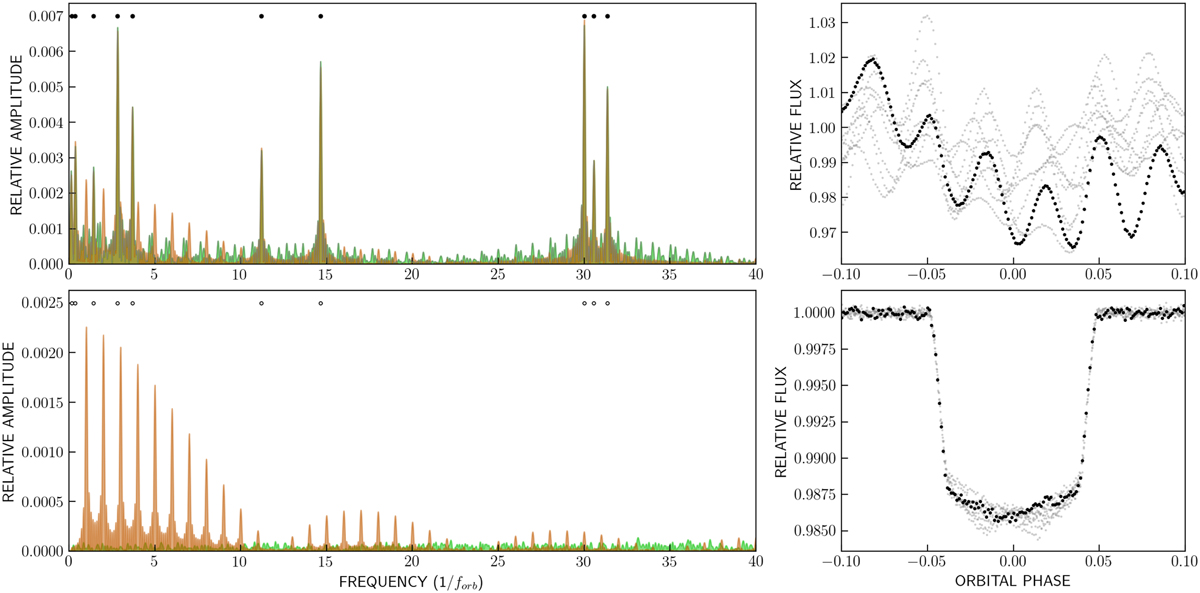
Illustration of the pre-whitening process on the data in the pxx series. The top and bottom rows correspond to the data before and after pre-whitening, respectively. Left panels: Fourier transform of the full dataset, shown both with the inclusion and exclusion of the transit phases (brown and green colours, respectively). Note: the amplitude of the prewhitened spectrum (bottom left) is shown with a ten-fold increase. The frequencies detected by Period04 are shown by filled or empty circles, depending on whether the signal is present or not in the data. Right panels: corresponding folded synthetic dataset (light gray), as well as the data of the first orbital cycle (black).
Current usage metrics show cumulative count of Article Views (full-text article views including HTML views, PDF and ePub downloads, according to the available data) and Abstracts Views on Vision4Press platform.
Data correspond to usage on the plateform after 2015. The current usage metrics is available 48-96 hours after online publication and is updated daily on week days.
Initial download of the metrics may take a while.