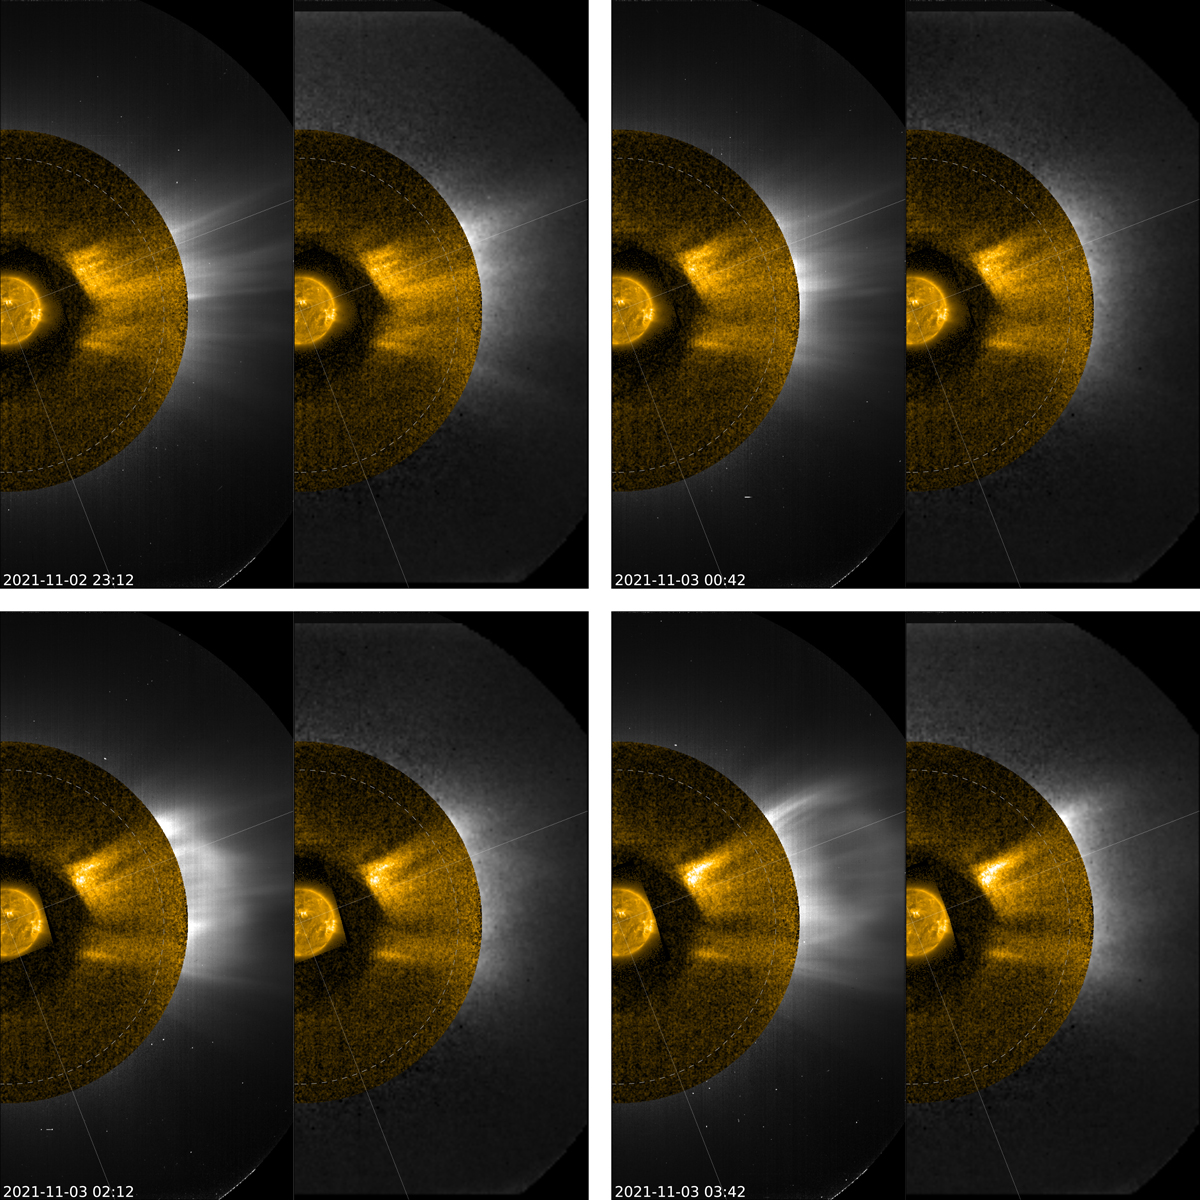
Fig. 8.
Download original image
Propagation of a CME across the FSI and Metis FOVs. Left and right sides of each panel show a comparison of SWAP (below 2 R⊙) and FSI 17.4 nm (up to 5.6 R⊙) with Metis VL and Lyman α data, respectively. The dashed circle marks the position of the edge of the Metis occulting disk. An animated version of the figure is available online.
Current usage metrics show cumulative count of Article Views (full-text article views including HTML views, PDF and ePub downloads, according to the available data) and Abstracts Views on Vision4Press platform.
Data correspond to usage on the plateform after 2015. The current usage metrics is available 48-96 hours after online publication and is updated daily on week days.
Initial download of the metrics may take a while.