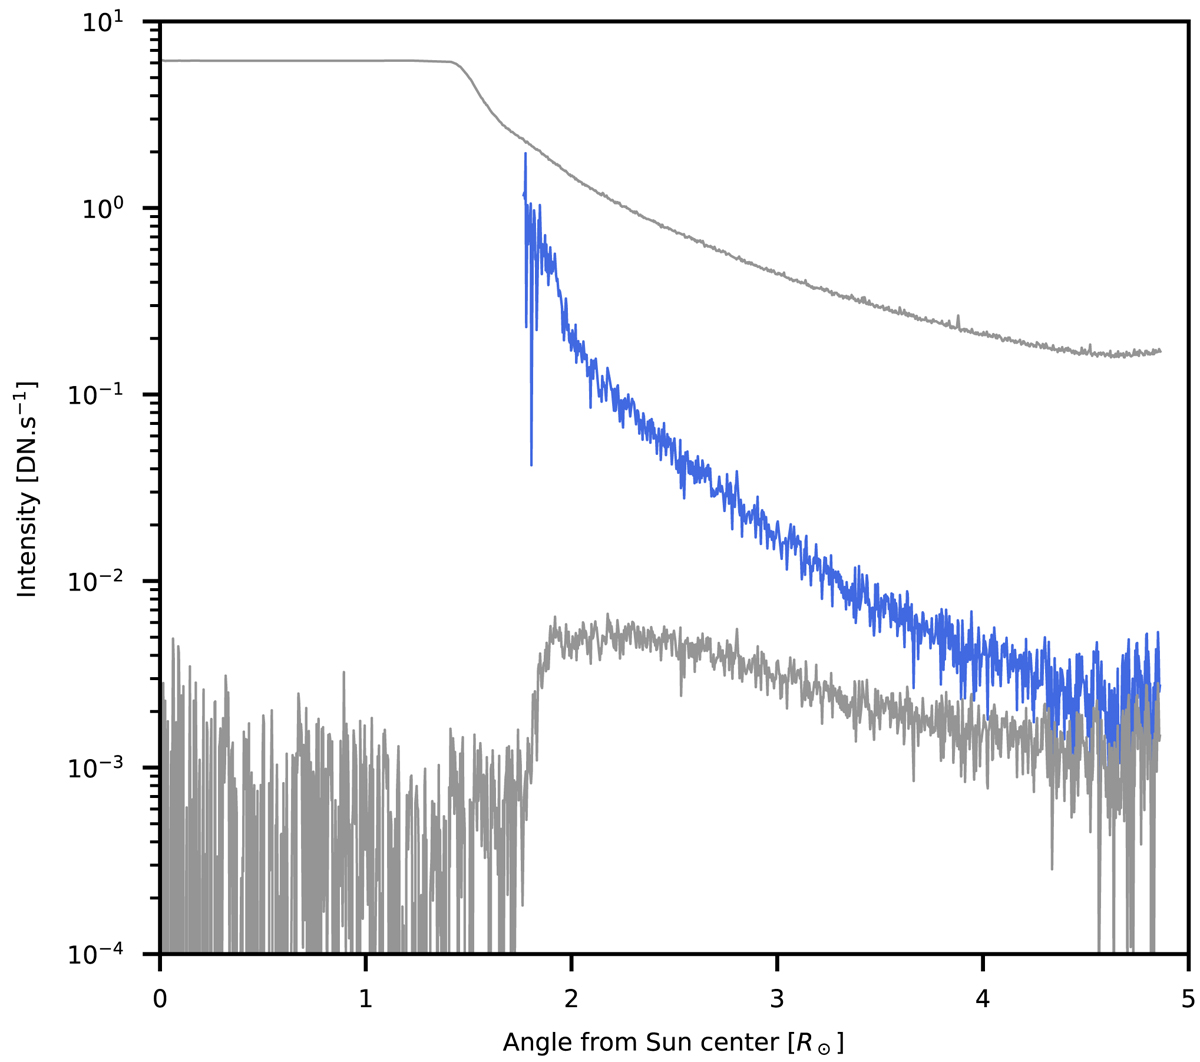
Fig. 5.
Download original image
Raw (lower gray) and vignetting-calibrated (blue) radial 17.4 nm intensity profiles, averaged over the sector shown in Fig. 3. The top curve corresponds to the data taken without the occulting disk.
Current usage metrics show cumulative count of Article Views (full-text article views including HTML views, PDF and ePub downloads, according to the available data) and Abstracts Views on Vision4Press platform.
Data correspond to usage on the plateform after 2015. The current usage metrics is available 48-96 hours after online publication and is updated daily on week days.
Initial download of the metrics may take a while.