Fig. 5.
Download original image
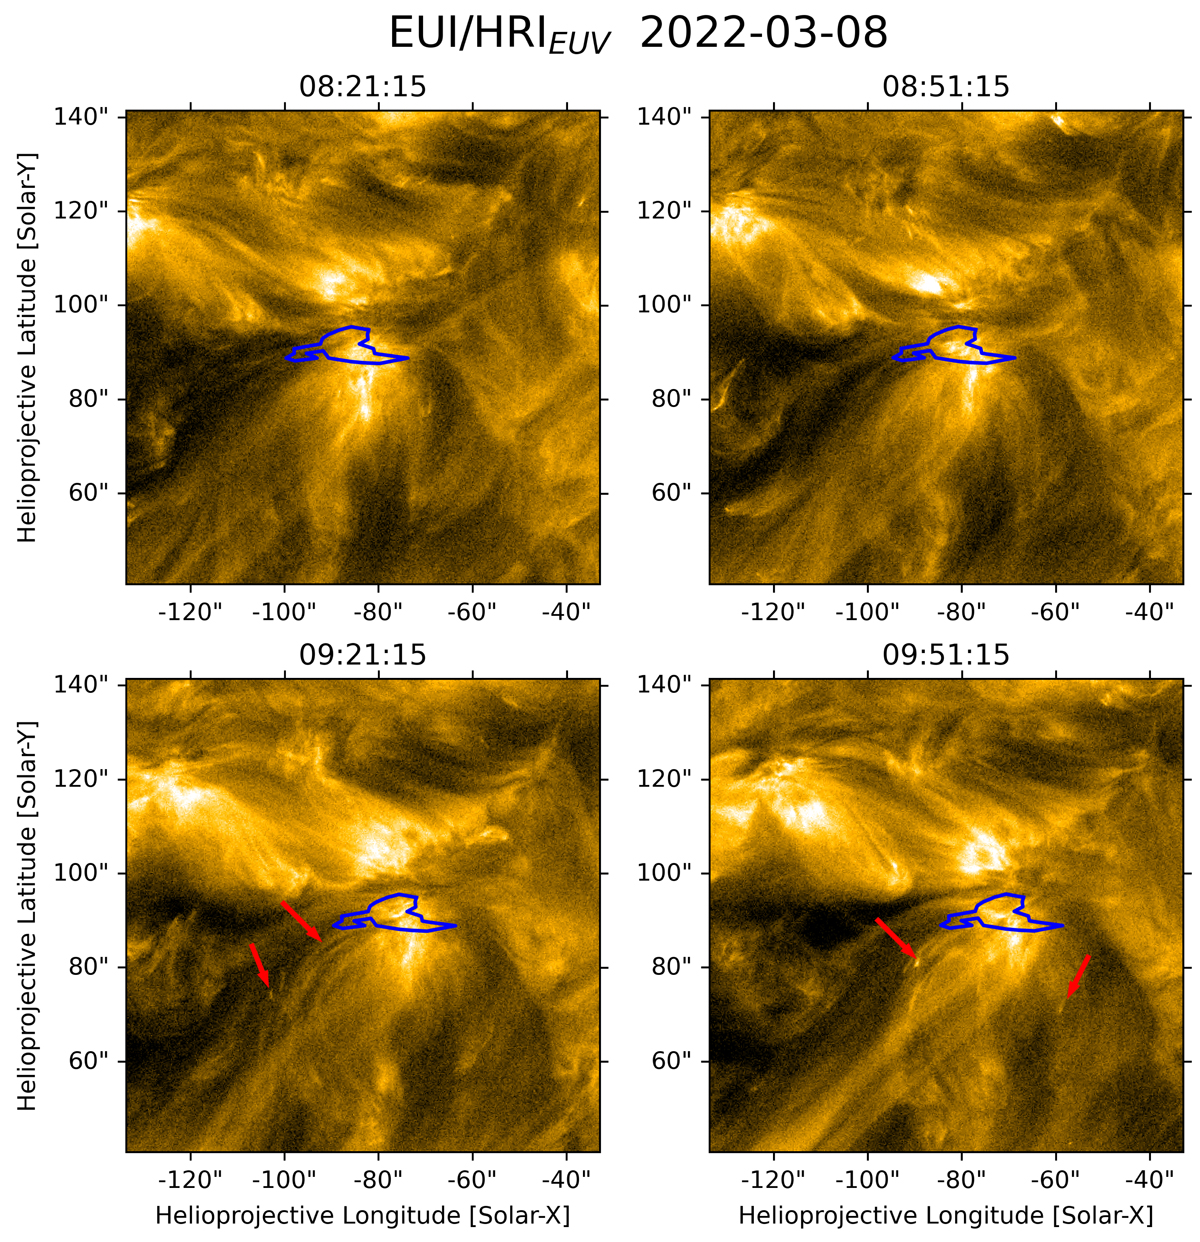
Observation of HRIEUV showing that the large bright footpoint region of the different loop systems, where we observe the strongest upflows, is rather stable over time. All plots are re-projected to an Earth-based helioprojective coordinate system. Top-left panel: three different loop systems. The left one corresponds to the longer loops which are clearly visible in AIA 193 Å. The central one connects to HMI polarities at [−90″, 50″] and the right one, which is the shortest connects to negative polarities at [−70″, 55″]. Top-right panel: structure and loop systems remain stable over a time period of 30 min. Bottom-left panel: brightenings at the footpoints of the central loop system are highlighted, such as isolated brightenings within individual loops. Bottom-right panel: loop brightenings and travelling brightenings flow along the medium-sized central loops and the shorter loops in the eastern system.
Current usage metrics show cumulative count of Article Views (full-text article views including HTML views, PDF and ePub downloads, according to the available data) and Abstracts Views on Vision4Press platform.
Data correspond to usage on the plateform after 2015. The current usage metrics is available 48-96 hours after online publication and is updated daily on week days.
Initial download of the metrics may take a while.