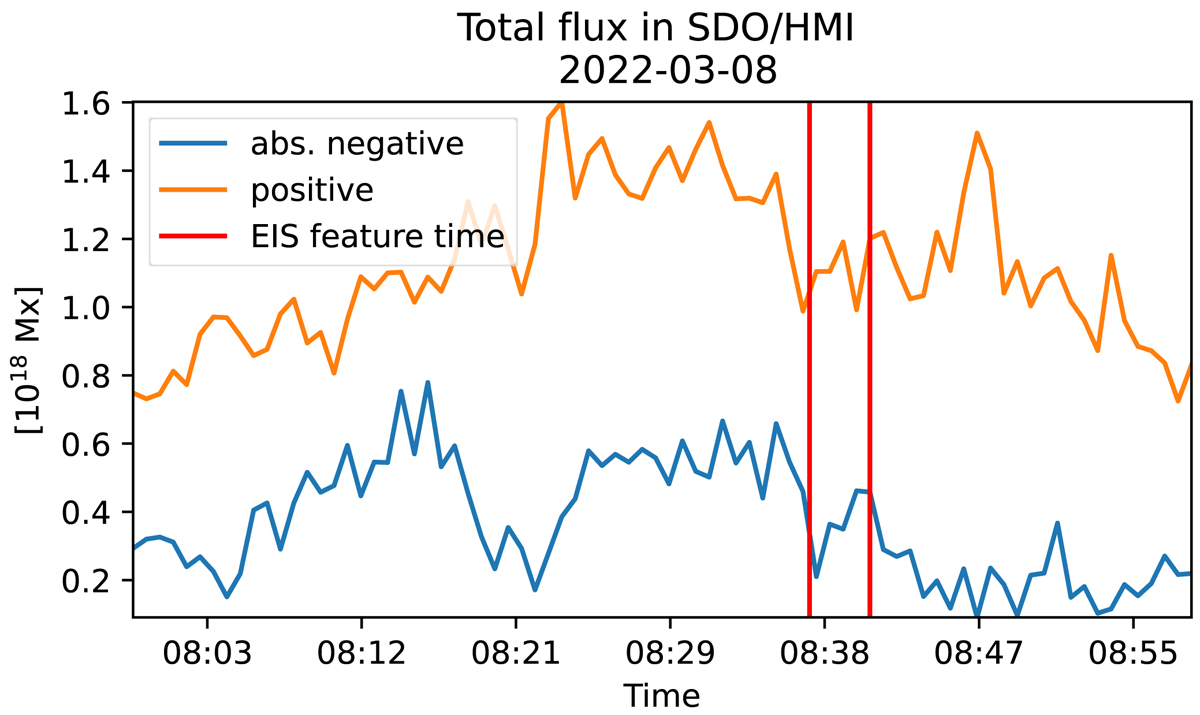
Fig. 3.

Download original image
Total flux within the region of the strongest upflow and its vicinity (highlighted by a black box in Fig. 2) starting with a strong positive polarity patch at the south-west edge and weak negative polarity at 07:59 UT. We see three time periods where the total negative flux gets stronger by more than a factor of two (08:05 UT, 08:20 UT, 08:37 UT) and then gets cancelled out by the approaching positive polarity (08:15 UT, 08:32 UT, 08:40 UT). The third such time period coincides with the time when Hinode/EIS observes the upflow (highlighted by red lines). Towards the end, the negative polarity mostly disappears and only smaller remnants are left.
Current usage metrics show cumulative count of Article Views (full-text article views including HTML views, PDF and ePub downloads, according to the available data) and Abstracts Views on Vision4Press platform.
Data correspond to usage on the plateform after 2015. The current usage metrics is available 48-96 hours after online publication and is updated daily on week days.
Initial download of the metrics may take a while.


