Fig. 13.

Download original image
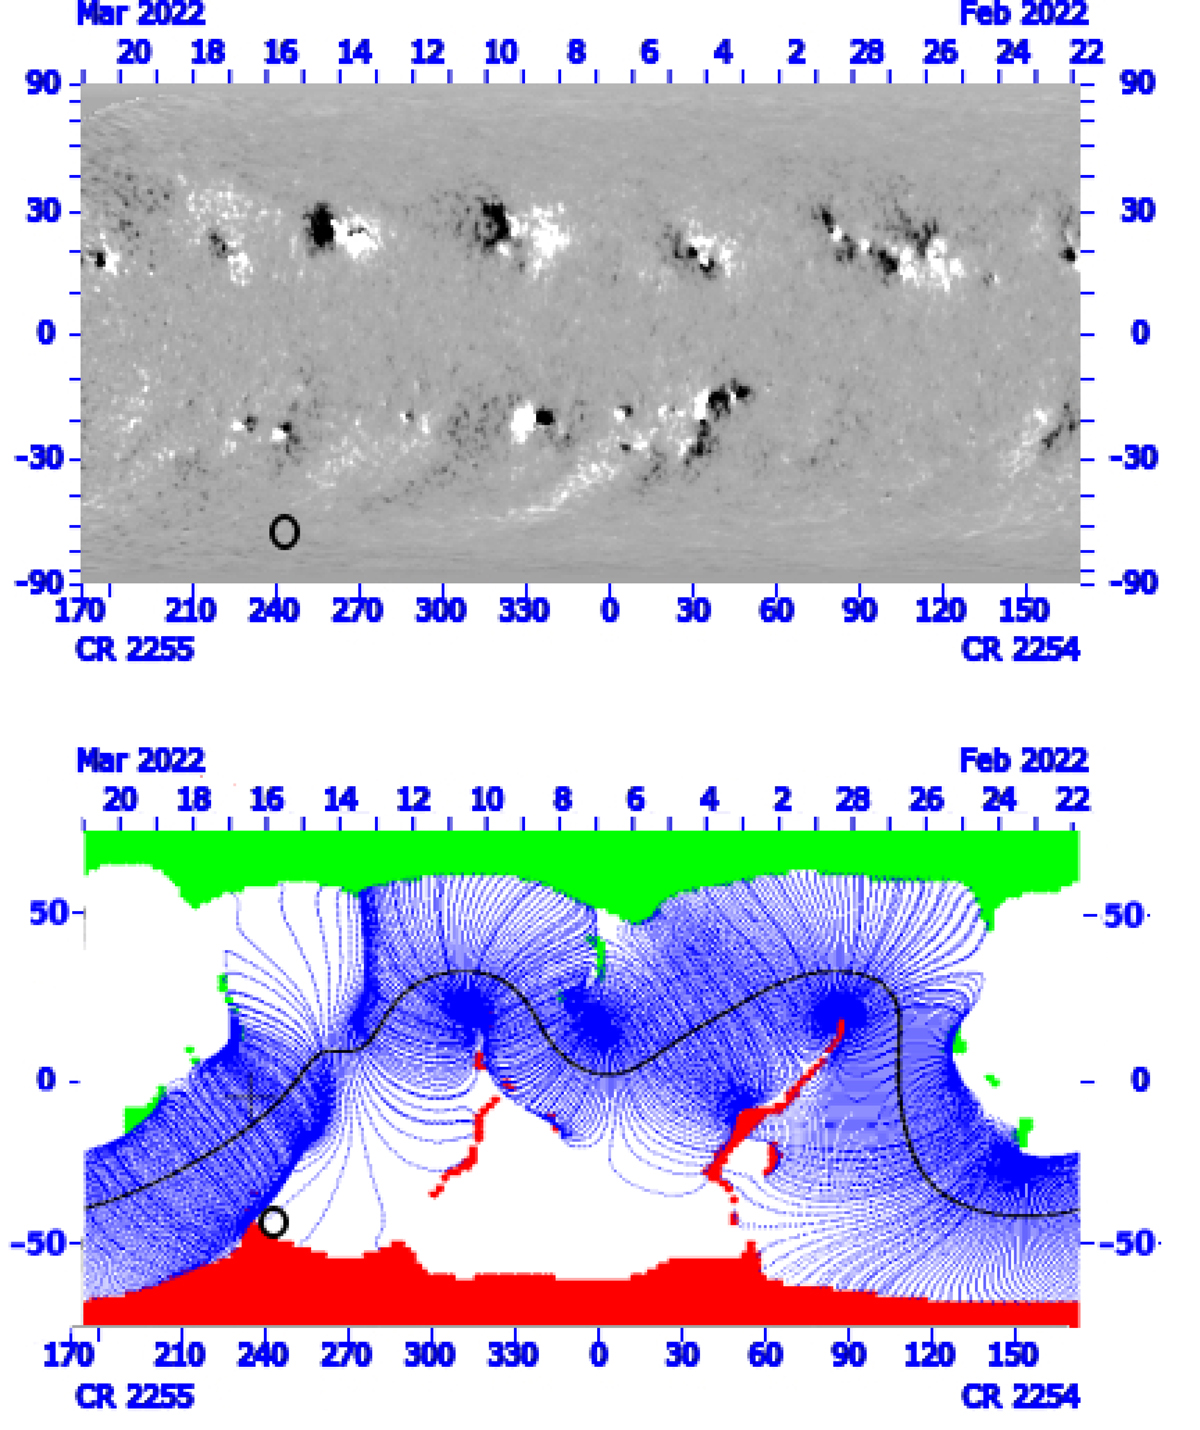
Synoptic map of CR 2255 and the corresponding Potential Field Source Surface (PFSS), suggesting that the upflow region on 17 March 2022 is located in a region of open magnetic field lines. Top panel: GONG synoptic map of CR 2255. White (black) corresponds to positive (negative) polarity field; the field values have been saturated above (below) 60 G. Bottom panel: PFSS model of CR 2255. The tallest closed field lines are shown. All field lines that reach 2.5 R⊙ are open by assumption, and so the tallest closed field lines are those with a vanishing radial component just below. Such field lines separate regions of open and closed magnetic fields. Coronal holes have their footprints at the photosphere represented by patches of colour: green denotes coronal holes with positive photospheric polarity and red with negative. In the plot, the neutral line on the source surface, which shows a quasi-sinusoidal pattern, is shown by a thick black line (see https://gong.nso.edu/data/magmap/fmodel.html). The black circle denotes the region of interest in both panels.
Current usage metrics show cumulative count of Article Views (full-text article views including HTML views, PDF and ePub downloads, according to the available data) and Abstracts Views on Vision4Press platform.
Data correspond to usage on the plateform after 2015. The current usage metrics is available 48-96 hours after online publication and is updated daily on week days.
Initial download of the metrics may take a while.


