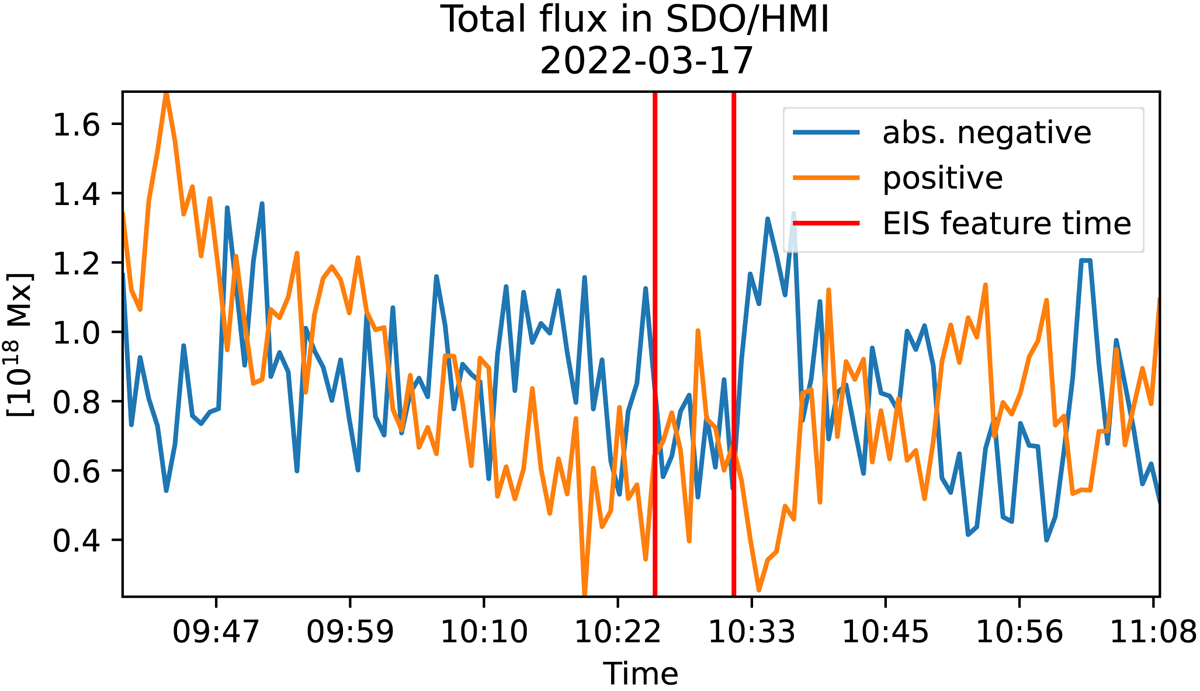
Fig. 11.

Download original image
Total flux within the region of the strongest upflow (highlighted by a black box in Fig. 9) starting with a strong positive and weak negative polarity at 09:40 UT. The positive flux gets cancelled out by the rising negative polarity until it exceeds it at 10:30 UT. Towards the end, no strong polarities are present. The vertical red line shows the time when the upflow was measured by Hinode/EIS.
Current usage metrics show cumulative count of Article Views (full-text article views including HTML views, PDF and ePub downloads, according to the available data) and Abstracts Views on Vision4Press platform.
Data correspond to usage on the plateform after 2015. The current usage metrics is available 48-96 hours after online publication and is updated daily on week days.
Initial download of the metrics may take a while.


