Open Access
Fig. 3.
Download original image
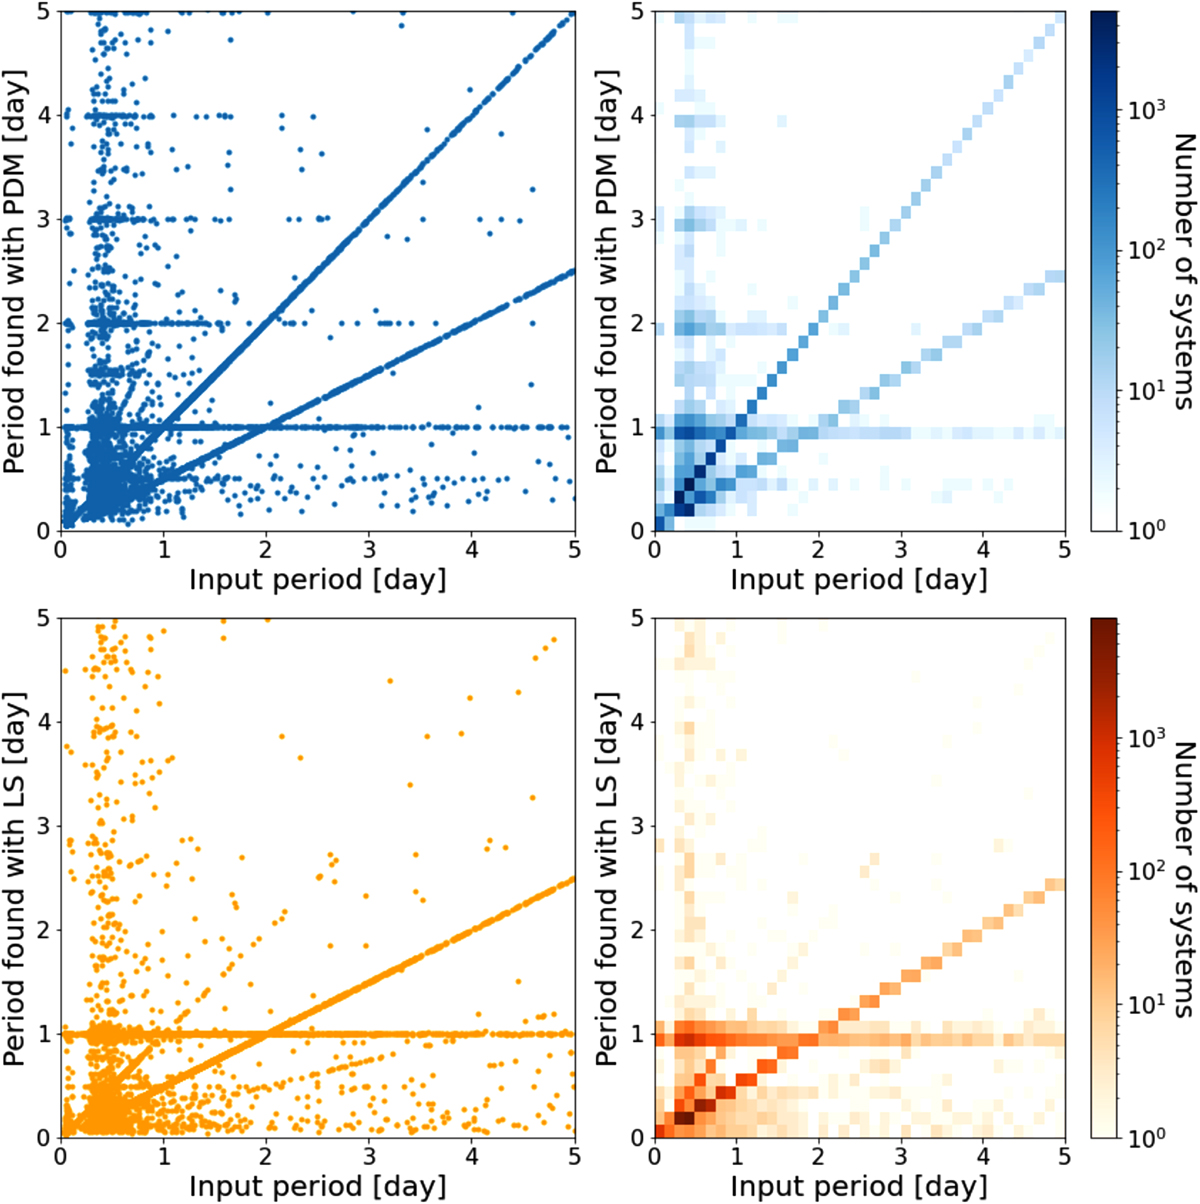
Comparison of the injected and recovered periods for PDM (top row; shades of blue) and LS (bottom row; shades of orange) analysis. The results are plotted on a Pinput − Pfound plane. To highlight all aspects, the left panels show all individual points, while the right panels present logarithmic number densities.
Current usage metrics show cumulative count of Article Views (full-text article views including HTML views, PDF and ePub downloads, according to the available data) and Abstracts Views on Vision4Press platform.
Data correspond to usage on the plateform after 2015. The current usage metrics is available 48-96 hours after online publication and is updated daily on week days.
Initial download of the metrics may take a while.