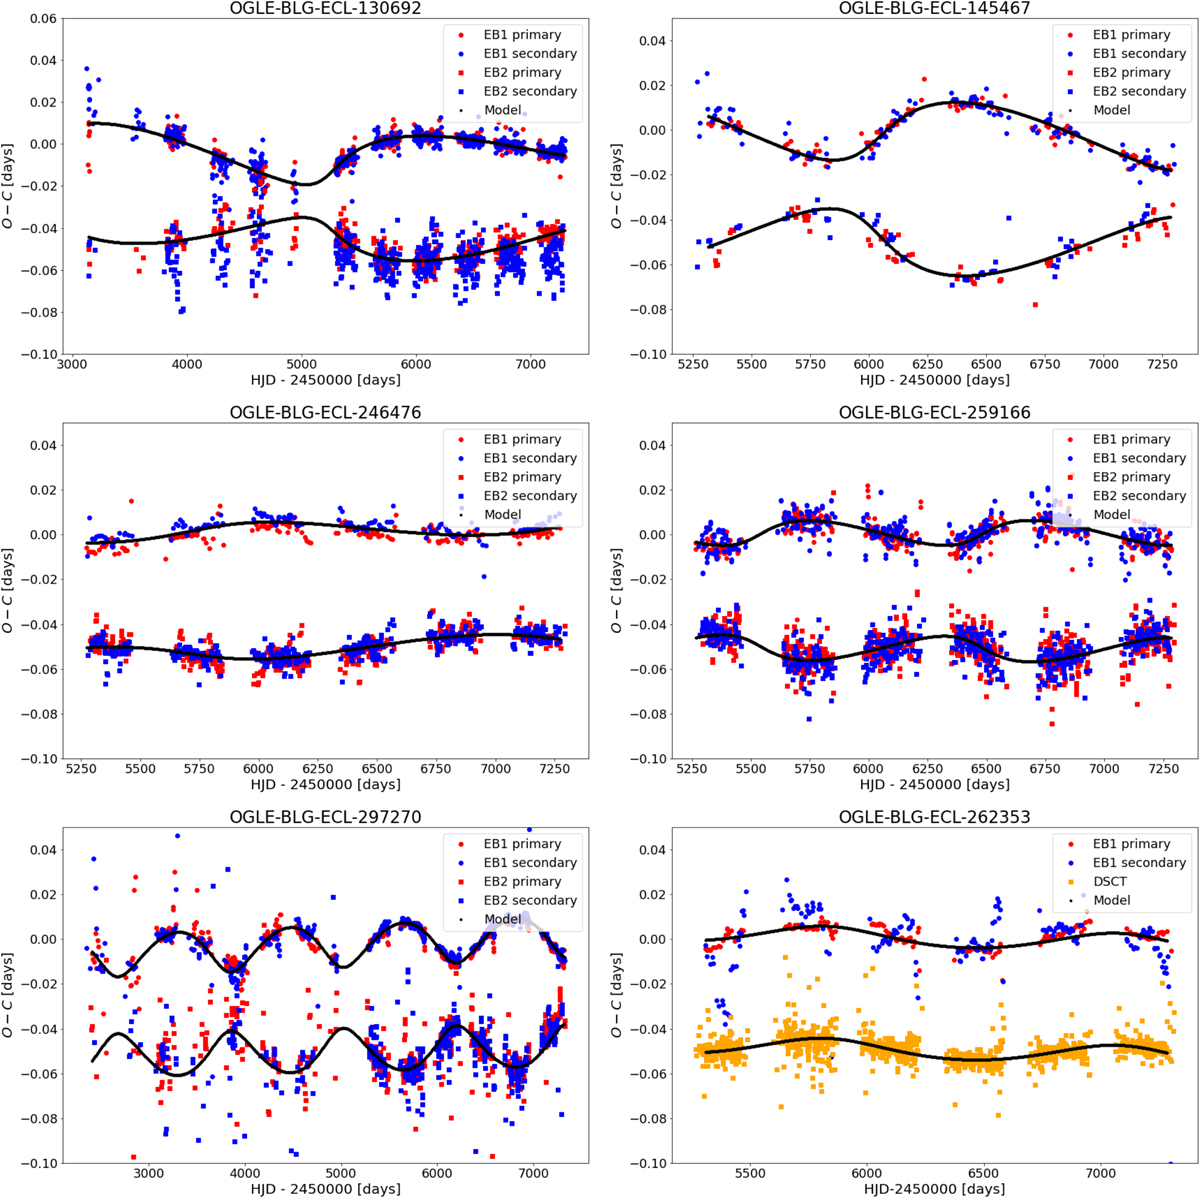
Fig. 13.
Download original image
ETVs of our candidate double EB systems and the triple candidate system with a δ Scuti pulsator (bottom right). For better visual transparency, we shifted the O–Cs of the background EBs and the δ Scuti by 0.05 days. The dots represent the O–C diagram of the foreground binary, while the squares represent the O–C diagram of the background binary. The red and blue colouring indicates the ETVs of the primary and secondary minima, respectively. The fitted LTTE is shown as a black curve. In the case of the triple star candidate system, the timing variations of the δ Scuti is marked with orange dots.
Current usage metrics show cumulative count of Article Views (full-text article views including HTML views, PDF and ePub downloads, according to the available data) and Abstracts Views on Vision4Press platform.
Data correspond to usage on the plateform after 2015. The current usage metrics is available 48-96 hours after online publication and is updated daily on week days.
Initial download of the metrics may take a while.