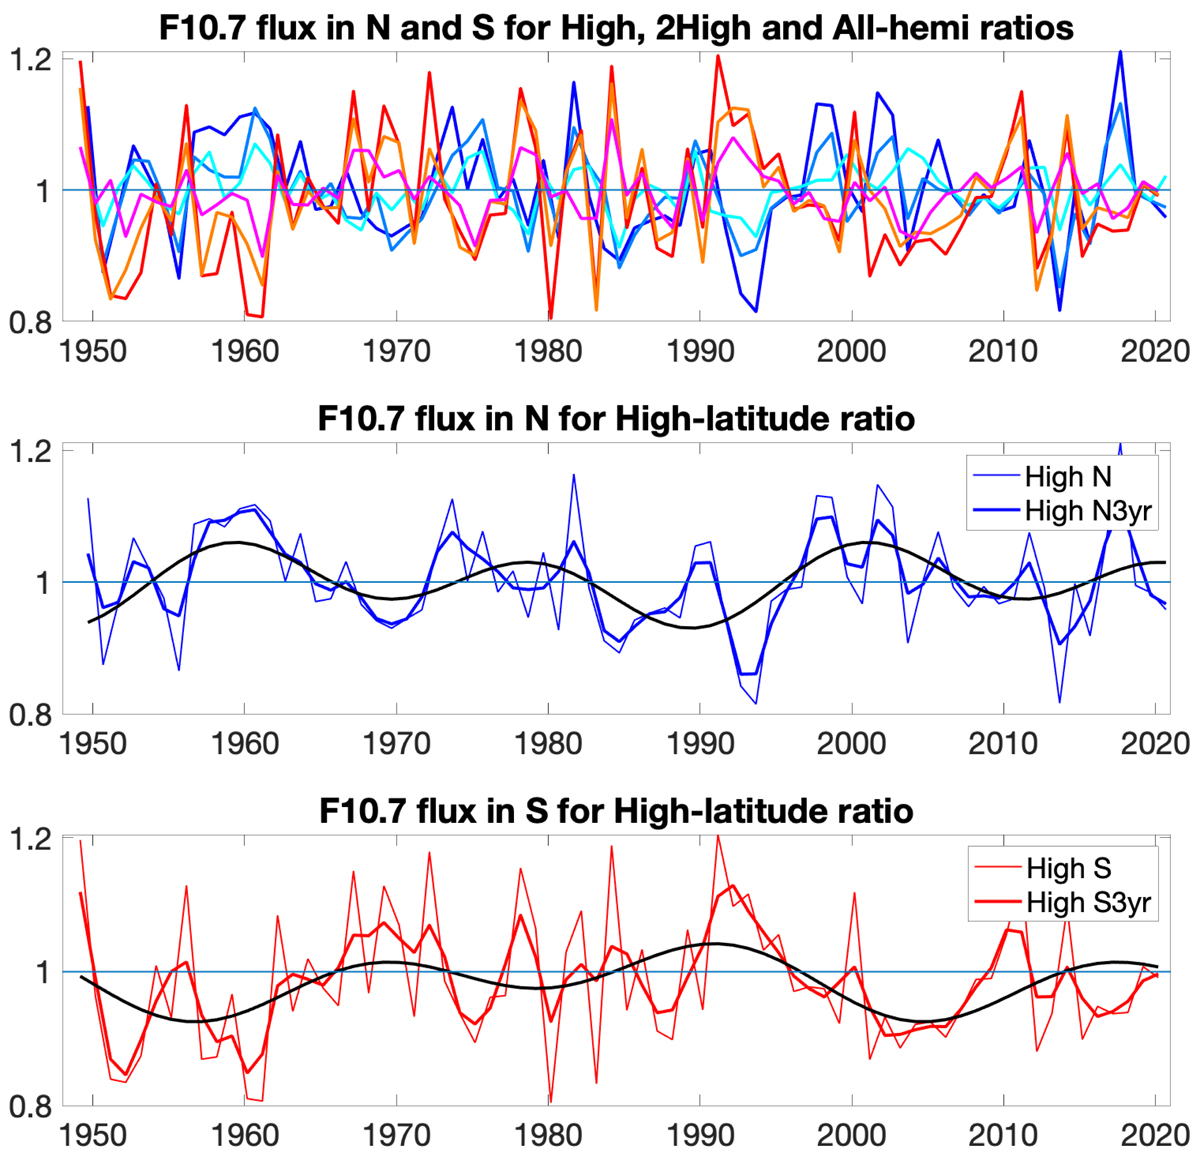
Fig. 4.
Download original image
Normalized hemispheric radio fluxes (in relative units). Top: normalized radio fluxes for the northern and southern hemisphere using high-latitude (blue for N, red for S), second high-latitude (light blue for N, orange for S), and all-hemispheric (cyan for N, magenta for S) time intervals (colors are the same as in the second panel of Fig. 1). Middle panel: yearly (thin blue) and 3 yr smoothed (thick blue) values of the normalized high-latitude radio flux for the northern hemisphere. A best-fit model consisting of two Fourier components is included as a black line. Bottom panel: same as in middle panel for the southern hemisphere, with blue color changed for red.
Current usage metrics show cumulative count of Article Views (full-text article views including HTML views, PDF and ePub downloads, according to the available data) and Abstracts Views on Vision4Press platform.
Data correspond to usage on the plateform after 2015. The current usage metrics is available 48-96 hours after online publication and is updated daily on week days.
Initial download of the metrics may take a while.