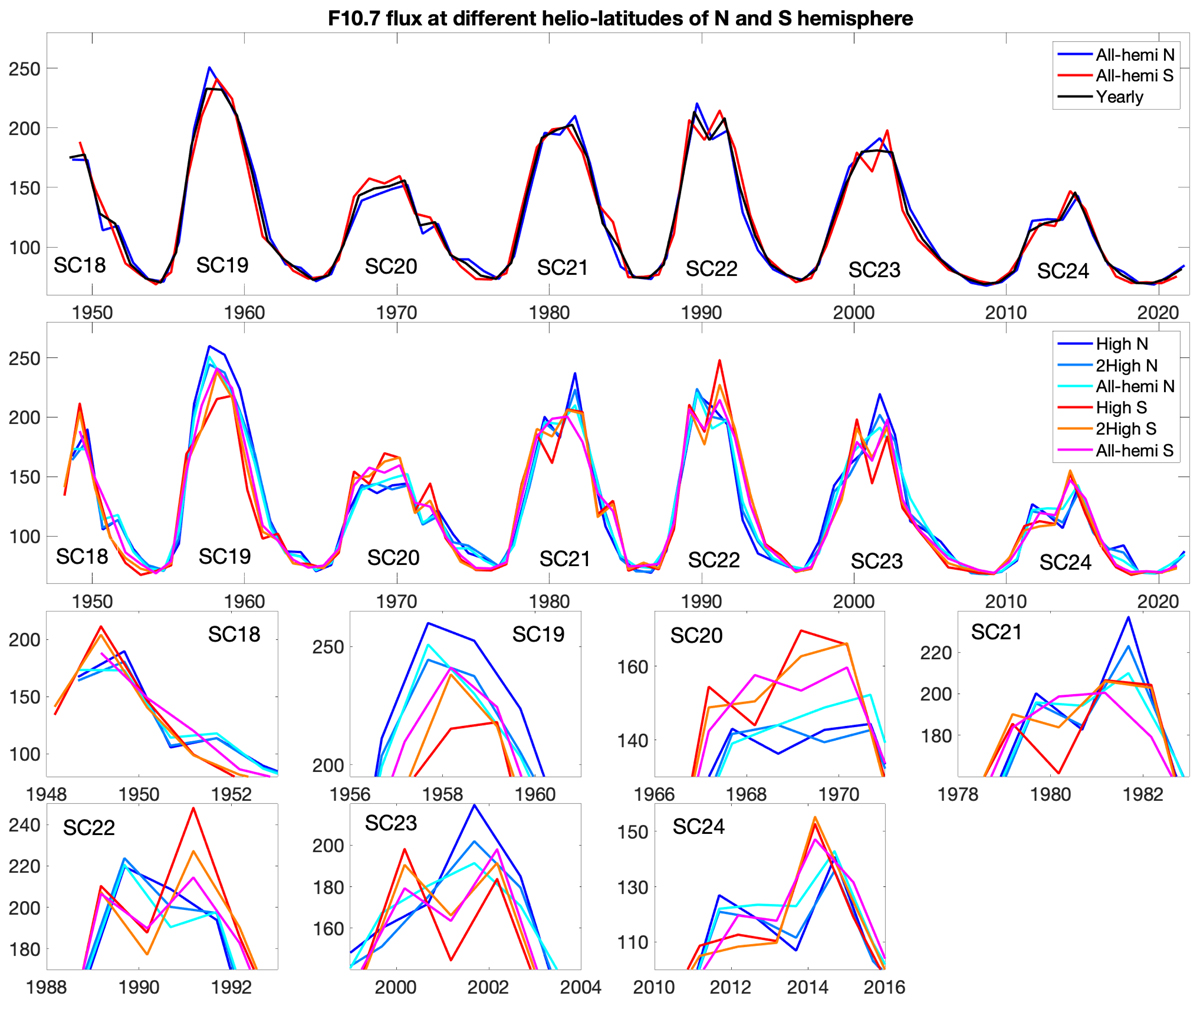
Fig. 1.
Download original image
Yearly hemispheric radio fluxes calculated at different helio-latitude intervals in 1948–2021. Top panel: all-hemispheric means of radio fluxes for the northern (N; blue line) and southern (S; red line) hemisphere in each year, together with the yearly mean radio flux (black line). Second panel: high-latitude (High), second high-latitude (2 High), and all-hemispheric radio fluxes for the northern (blueish colors) and southern (reddish colors) hemisphere. The seven small plots on the third and bottom row depict an enlarged view of the second panel, one for each of the seven solar cycle maxima. All fluxes are given in units of sfu.
Current usage metrics show cumulative count of Article Views (full-text article views including HTML views, PDF and ePub downloads, according to the available data) and Abstracts Views on Vision4Press platform.
Data correspond to usage on the plateform after 2015. The current usage metrics is available 48-96 hours after online publication and is updated daily on week days.
Initial download of the metrics may take a while.